Pages

Sunday, October 25, 2015

Win Tunnel Playtime - Part 2


In the previous blog post (Win Tunnel Playtime - Part 1), I described how this particular adventure came about, and I presented the bulk of the data collected, which was the result of a large amount of wheel and tire testing. In this post, I'll be covering the remaining testing we did on that day. In short, we did a small number of bike-only runs, varying the front wheel on the bike. This was done in an attempt to see how the differences in drag compared to the wheel-only runs for changes in front wheels. Most of the testing was done using my personal bike (a Stinner Frameworks custom steel road frame), and for comparison sake, we also tested a brand new Specialized Venge ViAS which just happened to be available <smirk>.

So...let's get to it. Shown below is a summary plot of all of the bike-only runs. As a bit of explanation, the combinations tested were as follows:

  1. Stinner with Hed Jet6+ wheels and 24C Specialized Turbo Cottons. Specialized Virtue bottle. This setup represents my own personal rig, set up in what I like to call "crit mode".
  2. Same as #1, with front wheel swapped for a Roval CLX64 with a 22C Specialized S-Works Turbo tire.
     
  3. Same as #1, but with front wheel swapped for Flo 90 with 23C Continental Super Sonic tire.
  4. Same as #3, but with round bottle and bottle cage swapped over from Venge ViAS frame on downtube (low location).
  5. Venge ViAS with Roval CLX64 wheels, 22C Specialized S-Works Turbo front, 24C rear. Round bottle on downtube.


Aside from how impressively low the drag is for the Venge ViAS in that chart above, what is particularly interesting is how those 3 upper plots (with the same bottles on the bike) compare to each other, AND to the wheel-only data. To do that comparison, I looked at the differences seen between those particular combinations of wheels and tires during the wheel-only testing and compared them to the bike testing.  Those comparisons are summarized in the following 3 charts.


What we can see from the above is that in most cases the differences in drag observed from wheel only data are within 0-.002 m^2 of the differences observed when those same wheels are swapped for the front wheel in a bike. There are a couple of differences that vary by .003m^2 in that data, but overall I'd have to say that the "predictive" utility of how a front wheel will perform within a bike based on wheel only data is pretty good.

Now we get to the part where we put a "floppy human" (me!) on board and see what happens.  Due to time constraints, for this portion of the data gathering we only took 2 yaw data points (0 and 10 degrees), which each consisted of 60s of sampled data. Since the Venge ViAS was there (and in my size!) of course I made sure to get a set of runs in on that. Since the Venge was the last bike from the bike-only runs and was already mounted to the tunnel balance platform, that was the first up.


Next was the Stinner with the Hed Jet6+ and Turbo Cotton tires (in my "crit setup")


And finally, we swapped the front wheel for the Roval CLX64 and 22C S-Works Turbo.


Here's how that all played out:


As you can see, the difference at zero yaw between the Roval wheel and the Jet 6+ (as configured) was ~.003 m^2, which compares pretty favorably with the ~.002-.003 m^2 observed in the wheel-only and the bike-only testing for those combinations.  

At 10 degrees of yaw, the difference appears to be somewhat larger, with the bike-with-rider testing showing a difference of ~.012 m^2 whereas the bike and wheel-only testing was more like .006-.007 m^2 of difference observed.

What's truly interesting though, is how closely the overall drag was brought together between the Stinner and the Venge ViAS when a rider is on board. At zero and 10 degrees of yaw, the drag difference appears to be less than half of what was observed in the bike-only testing. This puts my overall drag when on the Stinner to within .004-.006 m^2 of what it was on the Venge ViAS at zero and 10 degrees of yaw. Obviously, there must be something going on with bike interactions near the rider. Also, it's important to point out that the comparison between the bikes wasn't completely "apples to apples" since the water bottles were different. However, the Venge ViAS is designed to be basically "bottle neutral", so that's not too big of a factor. Another difference was that the bars were not identical, neither in model or in width. But again, the bars on the Stinner, although slightly narrower (40 vs. 42 for the Specialized bar) also have drops which are deeper...so, that probably ends up being a "wash" in the bike-only testing.

So...another large dump of data...with a few good conclusions. It appears that when making changes to the "leading edges" of the bike equipment (such as wheels, forks, bars, etc) drag differences observed in component-only and bike-only testing "hold" when applied to testing with a rider on board, at least for near zero yaw.  However, that probably can't be said for pieces of the puzzle that are further back in the flow and interact more closely with one another.

As always, if you have any questions, just fire away in the comments...oh, and the data for this portion of the testing is found here: Bike and Rider data
Monday, October 5, 2015

Win Tunnel Playtime - Part 1


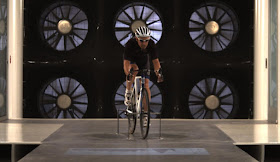
As I mentioned in my last post, thanks to the generosity of Specialized, Chris Yu, and Cam Piper (both pictured above), I recently had the opportunity to spend a day in Morgan Hill, CA at Specialized's Win Tunnel facility. You're probably asking "How did THAT happen?" (something I asked myself repeatedly)...and well, it's a long story. I had met Chris Yu a few years back when I had the opportunity to observe the wind tunnel testing of my friend and professional triathlete, Jordan Rapp. At the time, Specialized had recently opened their "Win Tunnel" facility and I had a great time watching the proceedings and trying not to be too annoying in peppering Chris and Mark Cote with questions. Since that time, Chris and I had "conversed" on various forums, and even swapped a few emails.

Earlier this year, Chris had sent me an email asking if I was interested in participating in one of their videos that they occasionally produce. I jumped at the opportunity and said "Sure!" and we planned on doing something in the July/August time frame. Well...one thing led to another, and the planned purpose of the video was changed...and then it turned out the video team wasn't going to be available on the dates we had planned. No worries though. As Chris explained to me, the tunnel time was already blocked out, and it turns out that like most forward thinking companies based in the SF Bay area (i.e. Google, Apple, etc.) Specialized allows their engineers time to "play", or pursue subjects that may not have an immediate application...on the thought that this "playtime" may spark some unexpected innovation. Chris told me we could brainstorm and come up with some things to look at, and like most tests, we'll most likely come up with some answers, but also some good additional questions to pursue. Sweet. How could I say no?

Due to the VERY large amount of data collected, what you'll see here in Part 1 is mostly the results of the morning of testing on that day in the Specialized Win Tunnel. I came up with the idea of trying a host of wheel and tire combinations, and then following it up with some of those same wheels and tires in bare bike tests...and then finally, I was hoping to get into the tunnel on a bike myself for a few runs. Shown below are the wheel/tire results. Part 2 (coming later) will show the remainder of the data. The idea was to see what sort of info could be gleaned about how wheel and tire combos are affected by the tire mounted (especially width) and if the differences observed "carried through" to both bare bike testing and testing with a rider. It was an "ad hoc" plan and group of equipment, but I figured at a minimum I would be getting a crash course in wind tunnel testing and the difficulties of doing so.


What you see above is the test matrix I put together for the wheel and tire testing. The wheels listed in the column on the left are the ones I would had available to me, and run the gamut from shallow to very deep. Across the top are listed the tires. Knowing that there was a limited time for the wheel/tire runs, I decided to go for a mix of tires on the wheels, with the one I was most interested in seeing was the one in the first column, the new S-Works Turbo 22C model. The greyed cells are the combinations tested, with the number in front of the hyphen the order in which they were to be tested. I wanted to make sure we weren't wasting time waiting for a tire to be swapped for a run.  The number after the hyphen is the measured width, as mounted.

So, let's get to the data...but, before we do that, I want to point out how difficult it is to get "clean" data using equipment this sensitive. Seemingly small things can throw some of the results off...which is why it's good to have guys with tons of experience running the show. For example, when we ran the first runs using a "known" wheel/tire combo (the Roval CLX64 with S-Works Turbo 22C), Cam immediately noticed that the positive yaw values seemed "off"...and it was traced to simply an end cap on the wheel fixture not being fully seated. Anyway, after 11 runs, here's how the data looked as a whole.


The big takeaway there is that the Roval CLX64 w/S-Works Turbo 22C truly is the "benchmark" for this grouping of wheels and tires tested. The Jet 6+, also with the S-Works Turbo 22C tire, basically matches it, although at the positive 15 deg point there appears to be an asymmetry (which should probably be investigated - Is it the wheel? Fixture? Tire?).

Looking closer at just the Jet 6+ runs, here's how they looked:


Another thing to note about the above data is that the Turbo Cotton 24C tire tested was my own personal tire with ~700 miles of front wheel use at that point.  As can be seen, the wider 24C tire gives up some drag, not only at zero yaw, but especially so at the higher yaw angles. However, don't forget that the Turbo Cotton tires have VERY good Crr properties, so when we look at this data in an "overall speed" context, the differences may not be as large. THAT analysis will be done in a later blog post.

Another wheel tested was my personal Zipp 101 wheel. For this one, I wanted to see the effects of tire width for such a shallow wheel, so the comparison was between the S-Works Turbo tires in both the 22C and 24C sizes. As you can see, the 2mm wider tires results in a fairly fixed offset across the range of yaw angles tested:


One of the things I wanted to check out in the wheel/tire testing was how well the venerable Specialized Trispoke/Hed H3 wheel performs vs. more modern wheels...plus, I wanted to see how well it worked with a VERY narrow tire, like it was designed around. As such, I took a brand new "out of print" Bontrager Aero TT 19C tire and compared it to the 20C Veloflex Record (that the wheel owner used as a tire) and also a 20C Continental Supersonic. As can be seen below, as compared to the Roval "benchmark", the older wheel leaves a bit to be desired, especially at yaw angles above 5 degrees. To be fair, this data doesn't include "power to rotate", which some claim can be a significant advantage for the Trispoke/H3. In any case, I think it's fair to say that of the tires tried, the 20C Continental Supersonic is probably the best combination of aerodynamics and Crr for that particular wheel.


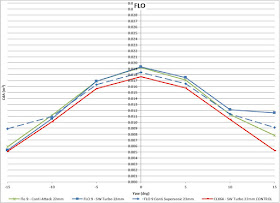
Lastly, we looked at my personal Flo 90 front wheel, comparing the aero performance between a Continental Attack 22C, a Continental SuperSonic 23C, and an S-Works Turbo 22C tire. The surprising result there (for me, at least) was how well the SuperSonic tire performed out to 10 degrees of yaw as compared to the other slightly narrower tires. Combine that aero performance with the excellent Crr of that tire, and it looks to be a tough combo to beat as a front wheel application (I'll have more on the aero+Crr combos in a later blog post). It's also important to note how well the Roval CLX64 wheel performed vs. a wheel 26mm deeper!


That's about it for now for this blog post.  There's a ton of data I'd like to go through, and I figured it was high time I started sharing some of this stuff.  I wanted to throw this stuff out there first to generate discussion. I'll have more analysis later.

For those interested, the entire data set can be found in this spreadsheet here: Wheel Aero Data