In my last post I outlined the "math behind the madness" of testing the rolling resistance of bike tires on home rollers. In this one, I'll be showing the results of some of that testing I've personally done over the past year or so. I'll also go through a few tips and tricks I've learned in doing this sort of testing...just in case anyone else is crazy enough to try some of this potentially mind numbing testing.
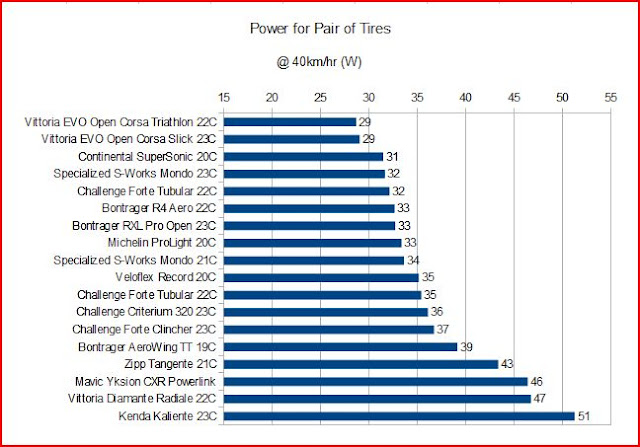
OK, I know a few of you are out there are "champing at the bit" to see the results, so without any further ado, here's a chart showing my estimates for the power to roll a pair of various tires I've tested (on a "real road" and for an 85kg bike plus rider mass):
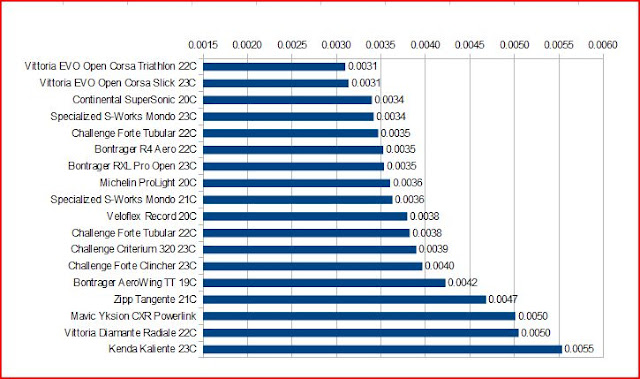
Here's the same chart, but showing the estimated "on road" Crr values:
As can be seen, that's a fairly wide range of power requirements. The wrong tire choice can easily "cost" a rider 10-15W of power to go a given speed. When choosing tires, I commonly think of a scene from "Indiana Jones and the Last Crusade" where the Templar Knight guarding the Holy Grail says "...you must choose, but choose wisely...". After all, when you're done with a race and you lose by seconds, or inches...you would hate to have the following be said about your tire choice:
The Setup:
OK, now that we've got that all out of the way, I thought I'd describe a bit about the setup I use for doing this sort of testing. As you can see in the pic at the top of this blog post, it's a fairly simple affair consisting of a set of 4.5" diameter Kreitler rollers, a front fork stand, and a bike equipped with a power meter (and a power meter head unit). That's really basically it. A couple of other pieces of equipment that are crucial for getting consistent results, in my experience, are:
- A means to measure ambient temperature
- A means to measure rear wheel load
- A separate speed sensor and magnet (NOT on the wheel, but on the roller - see below)
- A notebook and pen
Now then, let's talk about the speed sensor I mentioned above. One of the most important things to get an accurate measure of in this testing is the actual "ground speed" during the test. This can be done with a wheel mounted magnet and speed sensor, BUT that requires determining and changing the wheel rollout number for EACH tire tested. In my experience, that can be a bit problematic...especially due to the curved contact patch that is present on the rollers. It's very hard to get an accurate and consistent measure of wheel rollout that way. To solve that problem, I realized that instead of triggering a speed sensor on the wheel, I could instead attach a magnet to the end of one of the rear drums and then use a speed sensor triggering off of the drum. All I needed to do was to carefully measure the diameter of the metal drum (which will NOT be changing from test to test) and use THAT as the ground speed measurement for the testing. Here's what that looks like:
That's just a small rare-earth magnet attached to the end cap of the roller with double-sided tape, and a Garmin ANT+ speed/cadence sensor taped to the roller frame.
Lastly, the notebook and pen are where I write down the date, what tire I'm testing, the size, the ambient temps during the testing, the power meter zero offset numbers, and the actual measured tire width as mounted.
The Protocol:
Alright, so everything is set up and we've gathered all the stuff needed. What's next? How do I do this? Well, here's a quick rundown of how I go about doing a tire Crr test (in "10 easy steps"!) This isn't the only way to do it, but it's how I've settled on things after doing this testing for a while:
- Mount the tire on the test wheel - Most of my testing is done with my old yellow-cap PT wheel with a Mavic Open Pro rim. I started out testing with this wheel in order to get both a hub and crank power to determine the level of typical drivetrain losses in the setup. I wanted to know that for the occasions when I would be testing tires (such as tubulars) which I couldn't mount to the clincher PT wheel. Since I'm mainly interested in tires for time trials and road racing, I'll test them using a latex inner tube. Testing by others has shown that using a butyl tube can cause 10-15% higher Crr than with latex.
- Pump the tire to the test pressure - What pressure to use is really up to you. I chose to do all of my testing with 120psi. The reason I chose that value was mainly so that I could compare my results more easily to the results of others, most notably the testing done by Al Morrison. Understand that on a perfectly smooth surface, the higher the pressure you pump tire up to, the lower the measured power requirements will be...however, that will only be true on the rollers, or on flat surfaces that are just as smooth. On "real roads", i.e. roads with typical roughness, that isn't necessarily the case and there will tend to be a pressure above which higher pressures actually will make you slower overall. Anyway, the key here is to pick a pressure and stick with it through your testing so that you are comparing tires on an equivalent basis.
- Place the wheel in the test bike - Install the rear wheel in the test bike and place the chain in the chosen gear for the testing. I do my testing in a 53x13 gear for consistency. If it's not in there already, install the fork into the fork mount.
- Measure the rear wheel load - This is done how I described above. I'll usually only do this once during a session, and for me I've found it's typically within a pound or two each time (my body weight tends to be fairly stable). This doesn't seem to be a super-critical measurement either, since a 1 or 2 lb. difference will only result in ~1-2% error in the final calculation.
- Place rollers under rear wheel - At this point, move the scale out from under the rear wheel and slide in the rollers. To get a consistent placement of the rear wheel on the rollers, I'll lift the fork mount slightly off the ground while I allow the rear wheel to spin as it touches the 2 rollers and then I carefully place the fork mount on the ground.
- Climb on board - It's now time to saddle up. I usually approach the bike from the non-drive side and put my left foot on the pedal and then carefully swing my right leg over taking care not to disturb anything in the setup. I'll then spin the cranks to make sure the PM is awake and the speed reading is working, at which point I'll clip out and zero the PM through the head unit. I'll note the offset value (from my Quarq) in the notebook along with the ambient temperature.
- Tire warmup - Now it's time to warm up the tire to working temperature. Since my tests are done at 90 rpm (I find it's easier to hold a consistent rpm rather than focusing on the wheel speed) I'll warm up the tire at 95 rpm for 5 minutes. At the end of the 5 minutes, I'll stop and quickly check the PM zero offset and write the value down in my notebook along with the ambient temperature reading.
- The Test - Now it's time for the test. I'll bring the cadence up to 90 rpms and once that is steady, I'll start a 4 minute interval in the PM head unit. I'll concentrate on keeping a steady cadence through the whole interval, trying to be especially steady through the final 2 minutes since that is the section of the data I take the average power and ground speed from. At the end of the 4 minute test interval, I'll again note the PM offset (to make sure it hasn't moved appreciably during the test for some reason) and write down the ambient test. That's it. Test over...either I stop there, or if I have more to tires to test, I'll start back at step one (skipping the load measurement for repeat tests) and on through the remaining steps.
- Download Data - Now it's time to get the average power and ground speed values from the head unit. I'll typically load the file into Golden Cheetah and then highlight the final 2 minutes of each test session and read off the averages as calculated.
- Calculate the Crr - The final step is to take the average power and speed values, along with the wheel load and ambient temperature taken at the end of the test interval into a spreadsheet I've written to quickly do the calculations. I've loaded the spreadsheet onto Google Drive and it can be accessed here: Crr Spreadsheet
- After doing a number of runs using both the crank-based power meter and the PT wheel, I was consistently finding that for the gearing chosen and the lower power levels (typically 50-100W) seen on the 4.5" rollers, the drivetrain losses were on the order of 5%. That's the value I enter in the spreadsheet.
- I did a fair number of runs with the exact same tire and at different ambient temperatures to determine what I should use as the temperature compensation value. In my case, I found it to be ~1.36% change per deg C (lower Crr with higher temperatures). Here's the plot of those tests:
- I normalize the Crr values to 20C. If you want to know what the Crr would be at various temperatures, you can just enter those temperatures into the appropriate cell on the first sheet of the spreadsheet.
- Added 2/19/12 - I realized I forgot to point out that I use a "smooth to real road" factor of 1.5X to account for the higher energy dissipation requirements of typical road roughness. This value is based on comparisons of roller based Crr measurements ("translated" to flat surface) and actual "on road" Crr derived from field tests and other means (i.e. iAero coast down values) for the same tires.
Well...that's about all I can think of for now. Hopefully that will help encourage others to give this a try. It's really not that difficult to do and is a good way to help you to "choose wisely" when it comes to tires for your "go fast" bike setup.


