
In my last post I outlined the "math behind the madness" of testing the rolling resistance of bike tires on home rollers. In this one, I'll be showing the results of some of that testing I've personally done over the past year or so. I'll also go through a few tips and tricks I've learned in doing this sort of testing...just in case anyone else is crazy enough to try some of this potentially mind numbing testing.
OK, I know a few of you are out there are "champing at the bit" to see the results, so without any further ado, here's a chart showing my estimates for the power to roll a pair of various tires I've tested (on a "real road" and for an 85kg bike plus rider mass):

Here's the same chart, but showing the estimated "on road" Crr values:
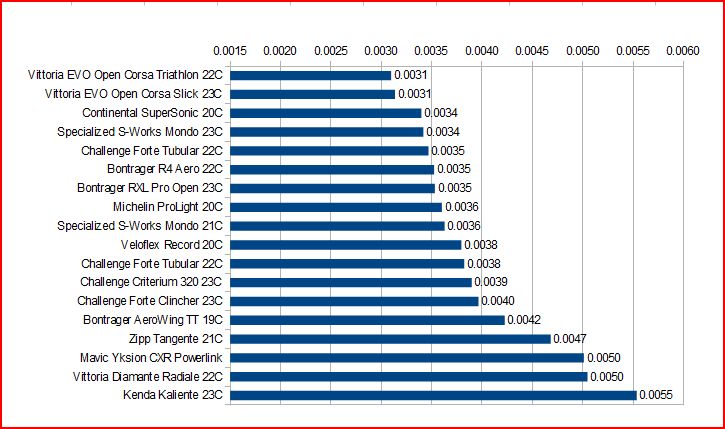
As can be seen, that's a fairly wide range of power requirements. The wrong tire choice can easily "cost" a rider 10-15W of power to go a given speed. When choosing tires, I commonly think of a scene from "Indiana Jones and the Last Crusade" where the Templar Knight guarding the Holy Grail says "...you must choose, but choose wisely...". After all, when you're done with a race and you lose by seconds, or inches...you would hate to have the following be said about your tire choice:
The Setup:
OK, now that we've got that all out of the way, I thought I'd describe a bit about the setup I use for doing this sort of testing. As you can see in the pic at the top of this blog post, it's a fairly simple affair consisting of a set of 4.5" diameter Kreitler rollers, a front fork stand, and a bike equipped with a power meter (and a power meter head unit). That's really basically it. A couple of other pieces of equipment that are crucial for getting consistent results, in my experience, are:
- A means to measure ambient temperature
- A means to measure rear wheel load
- A separate speed sensor and magnet (NOT on the wheel, but on the roller - see below)
- A notebook and pen

Now then, let's talk about the speed sensor I mentioned above. One of the most important things to get an accurate measure of in this testing is the actual "ground speed" during the test. This can be done with a wheel mounted magnet and speed sensor, BUT that requires determining and changing the wheel rollout number for EACH tire tested. In my experience, that can be a bit problematic...especially due to the curved contact patch that is present on the rollers. It's very hard to get an accurate and consistent measure of wheel rollout that way. To solve that problem, I realized that instead of triggering a speed sensor on the wheel, I could instead attach a magnet to the end of one of the rear drums and then use a speed sensor triggering off of the drum. All I needed to do was to carefully measure the diameter of the metal drum (which will NOT be changing from test to test) and use THAT as the ground speed measurement for the testing. Here's what that looks like:

That's just a small rare-earth magnet attached to the end cap of the roller with double-sided tape, and a Garmin ANT+ speed/cadence sensor taped to the roller frame.
Lastly, the notebook and pen are where I write down the date, what tire I'm testing, the size, the ambient temps during the testing, the power meter zero offset numbers, and the actual measured tire width as mounted.
The Protocol:
Alright, so everything is set up and we've gathered all the stuff needed. What's next? How do I do this? Well, here's a quick rundown of how I go about doing a tire Crr test (in "10 easy steps"!) This isn't the only way to do it, but it's how I've settled on things after doing this testing for a while:
- Mount the tire on the test wheel - Most of my testing is done with my old yellow-cap PT wheel with a Mavic Open Pro rim. I started out testing with this wheel in order to get both a hub and crank power to determine the level of typical drivetrain losses in the setup. I wanted to know that for the occasions when I would be testing tires (such as tubulars) which I couldn't mount to the clincher PT wheel. Since I'm mainly interested in tires for time trials and road racing, I'll test them using a latex inner tube. Testing by others has shown that using a butyl tube can cause 10-15% higher Crr than with latex.
- Pump the tire to the test pressure - What pressure to use is really up to you. I chose to do all of my testing with 120psi. The reason I chose that value was mainly so that I could compare my results more easily to the results of others, most notably the testing done by Al Morrison. Understand that on a perfectly smooth surface, the higher the pressure you pump tire up to, the lower the measured power requirements will be...however, that will only be true on the rollers, or on flat surfaces that are just as smooth. On "real roads", i.e. roads with typical roughness, that isn't necessarily the case and there will tend to be a pressure above which higher pressures actually will make you slower overall. Anyway, the key here is to pick a pressure and stick with it through your testing so that you are comparing tires on an equivalent basis.
- Place the wheel in the test bike - Install the rear wheel in the test bike and place the chain in the chosen gear for the testing. I do my testing in a 53x13 gear for consistency. If it's not in there already, install the fork into the fork mount.
- Measure the rear wheel load - This is done how I described above. I'll usually only do this once during a session, and for me I've found it's typically within a pound or two each time (my body weight tends to be fairly stable). This doesn't seem to be a super-critical measurement either, since a 1 or 2 lb. difference will only result in ~1-2% error in the final calculation.
- Place rollers under rear wheel - At this point, move the scale out from under the rear wheel and slide in the rollers. To get a consistent placement of the rear wheel on the rollers, I'll lift the fork mount slightly off the ground while I allow the rear wheel to spin as it touches the 2 rollers and then I carefully place the fork mount on the ground.
- Climb on board - It's now time to saddle up. I usually approach the bike from the non-drive side and put my left foot on the pedal and then carefully swing my right leg over taking care not to disturb anything in the setup. I'll then spin the cranks to make sure the PM is awake and the speed reading is working, at which point I'll clip out and zero the PM through the head unit. I'll note the offset value (from my Quarq) in the notebook along with the ambient temperature.
- Tire warmup - Now it's time to warm up the tire to working temperature. Since my tests are done at 90 rpm (I find it's easier to hold a consistent rpm rather than focusing on the wheel speed) I'll warm up the tire at 95 rpm for 5 minutes. At the end of the 5 minutes, I'll stop and quickly check the PM zero offset and write the value down in my notebook along with the ambient temperature reading.
- The Test - Now it's time for the test. I'll bring the cadence up to 90 rpms and once that is steady, I'll start a 4 minute interval in the PM head unit. I'll concentrate on keeping a steady cadence through the whole interval, trying to be especially steady through the final 2 minutes since that is the section of the data I take the average power and ground speed from. At the end of the 4 minute test interval, I'll again note the PM offset (to make sure it hasn't moved appreciably during the test for some reason) and write down the ambient test. That's it. Test over...either I stop there, or if I have more to tires to test, I'll start back at step one (skipping the load measurement for repeat tests) and on through the remaining steps.
- Download Data - Now it's time to get the average power and ground speed values from the head unit. I'll typically load the file into Golden Cheetah and then highlight the final 2 minutes of each test session and read off the averages as calculated.
- Calculate the Crr - The final step is to take the average power and speed values, along with the wheel load and ambient temperature taken at the end of the test interval into a spreadsheet I've written to quickly do the calculations. I've loaded the spreadsheet onto Google Drive and it can be accessed here: Crr Spreadsheet
- After doing a number of runs using both the crank-based power meter and the PT wheel, I was consistently finding that for the gearing chosen and the lower power levels (typically 50-100W) seen on the 4.5" rollers, the drivetrain losses were on the order of 5%. That's the value I enter in the spreadsheet.
- I did a fair number of runs with the exact same tire and at different ambient temperatures to determine what I should use as the temperature compensation value. In my case, I found it to be ~1.36% change per deg C (lower Crr with higher temperatures). Here's the plot of those tests:

- I normalize the Crr values to 20C. If you want to know what the Crr would be at various temperatures, you can just enter those temperatures into the appropriate cell on the first sheet of the spreadsheet.
- Added 2/19/12 - I realized I forgot to point out that I use a "smooth to real road" factor of 1.5X to account for the higher energy dissipation requirements of typical road roughness. This value is based on comparisons of roller based Crr measurements ("translated" to flat surface) and actual "on road" Crr derived from field tests and other means (i.e. iAero coast down values) for the same tires.
Well...that's about all I can think of for now. Hopefully that will help encourage others to give this a try. It's really not that difficult to do and is a good way to help you to "choose wisely" when it comes to tires for your "go fast" bike setup.
Nice.
ReplyDeleteThought experiment:
Can you do a VE of the speed v power trace for the interval, and get comparative Crr values that way?
Given you have a known Crr for a standard test tyre, you could then see what standard CdA value would level the plot and to use for future tests. I presume it would be pretty low as it's just a wheel and legs rotating.
Then use that standard CdA, set air density according to conditions, and then adjust Crr to level the plot for other tyres.
Then you can experiment across a range of speeds and also be less concerned with trying to hold a precise cadence/speed (especially if it's too hard to hold!).
Thanks Alex,
DeleteYeah...I thought of seeing how I could utilize VE in this, plus I originally did my runs where I would vary the speed. However, what I found is that the amount that the tires heat up is VERY sensitive to the roller speed and that the Crr is very sensitive to that temperature. In fact, I originally started doing runs where I'd stay in the same gear, but do 2 minutes at the following cadences: 80-90-100-90-80. There was a LARGE hysteris effect where the 2nd 90 and 80 rpm cadence sessions where significantly lower power than the first two. I even tried some runs that went 90-80-90-100-90 and even that was a bit of a dog's breakfast. My intent was to plot P/V vs. V^2 and do a linear fit to tease out the Crr force from the aero drag force of the wheels...but that wasn't very fruitful.
At that point I decided to just pick a set steady-state protocol and go from there. BTW, with the way I have things set up, I really don't NEED to hold the cadence or speed very precisely, I just need to make sure the power and speed values are accurate. Holding the rpms to close to 90 just ensures that the wheelspeeds are drastically different and I don't start seeing some of those wheelspeed temperature effects I mentioned above.
Do you think there is any error in your ground speed measurements? I seem to remember TrainerRoad talking about using an Ant+ speed sensor just as you have described. Their objective was to measure "Rolling Resistance" of a normal trainer. If I remember correctly they indicated that the Ant+ protocol did not pass enough data to get accurate results.
ReplyDeleteAlso Kurk Kinetic's InRide was suppose to be Ant+ but it ended up being low power bluetooth. Not sure what the reason for the change but it's easy to speculate that there was some problem with using Ant+ to communicate the data.
As you probably know the KK InRide is basically exactly what you show above.
I don't appear to be having any issues with the ground speed measurement...then again my testing is done at a fairly steady-state condition, so perhaps the issues had to do with quickly varying conditions? The ground speeds reported for the various size tires and a fixed gearing and cadence appear to follow the tire size fairly well. My only concern with the setup was whether or not the reed switch inside of the Garmin speed sensor could react fast enough to the much higher rate of triggering that occurs with the small roller. That doesn't seem to be an issue...in fact, I've used the same technique before on the fan shaft of a LeMond trainer which is spinning at 8X the rate of the cassette!
DeleteDo you think you could do this setup on the emotion rollers? The reason i am asking is that i would like to calculate my Crr for various mountain bike tires, but one of my mountain bikes are thru axle and the other one is a cannondale lefty, so i could not use the normal mount like you have. Also, i can find someone who has an emotion roller, but am not sure if i could borrow a roller w/ the fork mount like what you have. Thanks,
ReplyDeleteSure, that should work. You'll just have to make sure you modify the equations to account for the front roller. See my previous blog post on the equations.
DeleteWhat is the source of the Veloflex Record. Was it a newer model? Also did you see the Veloflex moved the Record to 22mm for 2013?
ReplyDelete-TG
That VF Record of mine is old...at least 5 or 6 years old, in fact. So...YMMV ;-)
DeleteYes, I saw that they say the tire is a 22c now. I wonder if they really changed it, or if they just changed the labeling to reflect the fact that the VF Record 20C typically measures over 21mm wide after a short period of use? :-)
Hi Tom. Any thoughts on the best way to measure CRR for track tires at 14 bar using something like this? Would it be necessary to somehow simulate the extra loads that you experience in the corners?
ReplyDeleteYou should be able to check them exactly the same. There would be no reason to "compensate" for the higher tire load from the corners since Crr is just a ratio of tire load to retarding force by definition.
DeleteYou also might want to reconsider pumping tires up that high, depending on the track surface. Too rough and/or too "soft" of a surface would end up causing those high pressures to actually be slower overall.
Hey Tom I was wondering where to get to front fork attachement for a set of rollers? I wanted to use this method for testing air vrs water.
ReplyDeleteMany roller manufacturers make them. The one I have is a Kreitler model.
DeleteI'd be careful with making any conclusions about on-road Crr for you favorite setup of water filled tires on smooth rollers due to the incompressiblity of water. Similar to how higher air pressure on smooth rollers leads to lower Crr, we know that's not the case once road roughness comes into play.
Cool appreciate it. I'm doing it for a Lab physics course where we have to come up with our own lab. Most of the stuff I was coming up with was to complicated or expensive so I finally settled on this. I'll include the uncertainty about the incompressibility, and roller smoothness compared to road roughness. If I could only come up with a way to determine the increase in pressure from riding with water. I suppose the data would be more applicable for riding on a track. I'm also going to run trials on a trainer with the wheel not in-contact(spinning freely) to try and determine any losses from the turbulence of the spinning water. At this point its really just for fun as I'm injured to the point I won't be able to ride competitively anymore.
ReplyDeleteAmazing blog post. With a bit more work I think you could publish this in a peer reviewed publication. I appreciated your "real world" approach to take in a more realistic 85kg (as opposed to Morrison's 45kg) weight and the attempted compensation for actual road conditions.
ReplyDeleteI would love to see this on Conti Gatorskins or 4000S.
Definitely a blog to bookmark.
This comment has been removed by the author.
ReplyDeleteThis comment has been removed by the author.
ReplyDeleteHow do these results compare to published values for Crr's? I've been thinking about this method a lot and the only reason I was hesitant about trying it for some time was that the set up has two contact patches vrs one. Not sure how much effect that would have on the Crr though. I can't wait till next year, I hope to test water, alcohol(if the chem deparment will hook me up), and oil, vrs a control of air.
ReplyDeleteI certainly think Michael is right you should run a couple more trials to collect more data get a average of the data sets produce some error bars and submit this to the Journal of Cycling Science. Its worth a shot. By the way when you google bike tire crr this is the first thing that comes up.
This comment has been removed by the author.
ReplyDeleteA very old post, but I think can share my two cents about your test. The difference that you were seeing related to temperature is not modifying the Crr on the wheel. I'm assuming that you were using a magnetic roller, and those roller induce a magnetic force into the metal "brake disc" inside the roller and make the disc to heat up. The higher the temperature of the disc, the lower the force generated by the magnets. That is why you see a decrease on resistance, but it was caused by the resistance of the magnets, not because of Crr
ReplyDeleteThe rollers do not have a magnetic load generator. The only additional drag is from the roller bearings.
DeleteThe temperature vs. Crr data was taken using AMBIENT temperature measurements...made after taking IR measurements of the tires during testing and seeing that the temperatures also followed the ambient values (which makes sense if you think about it).
Hi Tom, My memory isn't reliable about whether we have chatted in the past. I just saw some other tire stuff from you in Silca Journal, and I wanted to discuss it. Could you please email me at j.papadopoulos@neu.edu ? Thanks! Jim Papadopoulos
ReplyDeleteI hadn't read your protocol before Tom. Good read. I use your results and the results from Jarno (https://www.bicyclerollingresistance.com/) to decide which tyres to buy and use.
ReplyDeleteI have noted the differences you two sometimes attain from the same tyres. Looking at your protocol vs https://www.bicyclerollingresistance.com/the-test protocol, the thing I noticed is your "drum" is smooth and Jarno has a slightly rough surface.
As all the roads in my area are rough country roads that regularly bounce you off the saddle and aerobars, I am wondering is Jarno's test more relevant to me and my scenario? Am I missing something? Your thoughts?
Thanks so much for all the great information you post.
Even Jarno's test is not as representative as what it sounds like you are riding. If you are bouncing off the saddle then there is likely some very high hysteresis losses (Tire is propelling almost all your weight upwards). I would lower pressure until you stop bouncing?
DeleteThis blog is very helpful and informative for this particular topic. I appreciate your effort that has been taken to write this blog for us. How to pump a bike tire
ReplyDelete