I often get asked about how some of the other Continental tires roll, such as the Attack/Force models, and the 23C version of the SuperSonic tire. Well, thanks to Eric Reid (who sent me a new Attack and a slightly used Force) along with Thomas Gerlach (who sent me a VERY well used 23C SuperSonic) I know have a couple of those data points.
To be clear on the SuperSonic, when I say very well used, I mean VERY well used...according to Thomas, this tire has ~600-1000 miles on it of rear tire used. When mounted on my Mavic Open Pro test rim and inflated to 120 psi, I measured a flat section on the tread that was a full 7mm across. In other words, it was near "end of life" ;-)
So, without further ado, here are their results:
Continental Supersonic 23C (WELL worn) = .0027, 25W for pair @ 40kph
Continental Attack 22C = .0035, 32W for pair @ 40kph
Continental Force 24C = .0029, 27W for pair @ 40kph
By comparison, here's the results for the "benchmark" GP4000S:
Continental GP4000S 23C = .0034, 31W for pair @ 40kph
My suspicion is that a new 23C Supersonic would probably test out closer to .0030. The worn Crr result puts it currently at the top of my Crr chart, but with a hefty asterisk.
The result for the Attack model shows it to roll about the same as (or just slightly worse than) the GP4000S, but with its narrower profile (22.7mm vs. 24.2mm) it should be slightly more aerodynamic. The Force model rolled very well, although it too had a small amount of miles on it. It basically put it in a tie, or slightly behind the top mark for a brand new tire I've tested, the Specialized Turbo Cotton. However, it also measured a fairly wide 25mm on my narrow test rim. On a wider rim, such as a Zipp Super9 disc, it would most likely measure as much as 26mm.
The spreadsheet linked to in the upper right of this blog has been updated to include these results.
Showing posts with label Tires. Show all posts
Showing posts with label Tires. Show all posts
Friday, August 29, 2014

Tuesday, July 15, 2014
There's a new Sheriff in town...

If you check the link to the overall Crr spreadsheet in the upper right of this blog, you'll see that there's a new top entry. It's the tire pictured above, the Specialized Turbo Cotton 24C which was introduced today. It sits firmly at the top of my list of production tires I've personally tested on the rollers, with a predicted on-road Crr of .0029, as compared to the Crr of .0031 for a trio of tires that used to be in a virtual tie (the Vittoria EVO Open Corsa Triathlon 22C, the Vittoria EVO Open Corsa Slick 23C, and the Schwalbe IronMan 22C Tubular).
The fact that it's so well rolling is not surprising considering it's construction. Like those other 3 tires, it's based on a 320tpi cotton casing. The main difference from those other tires is, of course, the tread that's glued onto it, which in this case is made from Specialized's proprietary Gripton material that they introduced last year with the S-Works Turbo tire. I've found this compound to truly live up to it's name, as can probably be guessed by the amount of wear on the labeling in the picture above.
OK...great...so it rolls really well (~4W less for a pair @40kph as compared to the "benchmark" Continental GP4000S) and rides/handles great, but is it aero? Or, at least "aero enough"? As I've written before, Crr can make up for a great deal of aerodynamic "sins" http://bikeblather.blogspot.com/2013/04/why-tire-crr-matters.html . Is the Turbo Cotton at least aero enough to take advantage of its ultra-low Crr to make it a good choice when aero is of a concern? Apparently...yes.
In interactions with the folks at Specialized, I was given a spreadsheet that shows the drag data for a test run taken with Zipp 404FC clinchers in a Venge road bike. The tires tested were the S-Works Turbo, the Turbo Cotton, and the Continental GP4000S 23C, which has been shown to have excellent aerodynamics on a variety of wheels. The plot of CdA vs. yaw angle is shown below:

As you can see, it shows that the Turbo Cotton is basically tied with the GP4000S at low yaw angles (up to 5deg), but then the GP4000S results in up to .010 m^2 lower CdA at 15deg of yaw. It's also interesting that the S-Works Turbo appears to be more aero than the Turbo Cotton. This could perhaps be because of the "lip" at the interface of the glued-on tread and the casing on the Turbo Cotton.
Another way of looking at this is by combining the Crr results with the aero results. Here's what the combined power would be for 40kph (85kg load). As can be seen, the low Crr certainly helps the Turbo Cotton beat the GP4000S all the way out to 10deg, while at 15deg of yaw the Conti actually beats it by ~3-5W. Above 15deg, the margin narrows again.
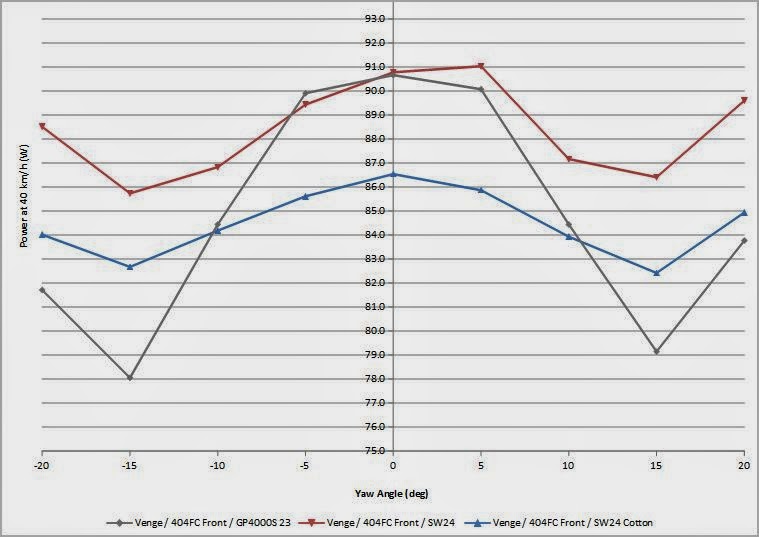
Well...it's pretty fairly obvious what I would do with this right? Time to analyze the combined aero+rolling drag for a weighted average of yaw angle, like was done in the blog post I linked to above. In short, here's how that turned out (using the Crr from my own roller measurements):

What does that mean? Well, using the Mavic generated wind yaw angle weighting (as in the previous analyses), it shows that the excellent Crr of the Turbo Cotton tire overcomes the lesser aerodynamic performance at higher yaw angles (as compared to the GP4000S), at expected apparent wind speeds up to >50 kph. And it stays faster than the S-Works Turbo all the way up to apparent wind speeds of 60kph. Fairly impressive.
I've ridden a pair of these tires on my road bike for the past few weeks...and I have to admit that I've found my new favorite "all around" tire for racing. It's a no-brainer selection for road races and crits due to its naturally (because of the construction) good ride quality and cornering grip (because of the tread compound). I've yet to TT on these tires...but it's pretty tempting. They seem to work fairly well for Tony Martin for that purpose. Then again, I have a feeling Tony Martin's average apparent wind yaw angle is pretty darned low :-)
Friday, August 30, 2013
Schwalbe Ironman Tires - A Clincher, A Tubeless, and A Tubular

Update Note: Since the testing of these tires and the publishing of this post, it's come to my attention that Schwalbe has apparently discontinued using latex tubes within their tubular tires. As such, one should expect the tubular version of the IM tire to roll significantly slower than tested below; in the range of 2-4W slower per tire. The tire tested will now be listed in my spreadsheet summary as "Out of Print" - 14 Nov 2015
Earlier this year, Schwalbe announced a set of tires marketed towards the triathlon/TT crowd...in fact, they're branded with the Ironman logo, so it's not too hard to figure out the target market ;-)
Anyway, the interesting thing about this announcement was that it wasn't just a single tire, but actually 3 tires: a clincher, a tubeless, AND a tubular model. The design goal for this line of tires was to come up with the best combination of tire properties (i.e. Crr, aero, and durability) for going fast (and far) against the clock. For aero, the tires are sized at 22C and have a noticeable parabolic shape. Additionally, there's a pattern molded into the sides of the tire that is intended to act much like the boundary layer trip features we've seen on tires like the Mavic CXR offerings.
Luckily, I was able to get my hands on a set of these tires and was able to put them on the rollers to see how they do. Upon first inspection, the clincher and the tubeless tires appeared to be virtually identical, with the tubeless model appearing to have an extra layer molded to the inside (most likely an air barrier layer), so I expected the tubeless to roll slightly worse than the clincher model with a latex tube. The tubular model is actually a traditional style "sew up" (i.e. a casing with glued on tread, not a 1 piece vulcanized model) with what appears to be a fairly high TPI casing with the a tread cap glued on that looks and feels just like the clincher and tubeless models.
So...how did they roll? Here's the answers:
Schwalbe Ironman Tubular (22C) = .0031
Schwalbe Ironman Tubeless (22C) = .0035
Schwalbe Ironman Clincher (22C) = .0041
Interestingly enough, it appears that the tubeless version has LOWER Crr than the clincher, even with the clincher using a latex tube. I find that very curious...that means there must be something different about the compounding or the casing with the tubeless, because there's no way an added butyl air barrier layer should be lower loss than a latex inner tube. In fact, at the time of the testing, the Schwalbe Ironman tubeless model was the fastest rolling tubeless tire I had tested, or even as compared to the tubeless tires Al Morrison has tested in the past.
Curious about what some miles would do to the Crr on the tubeless model, I left it on my rear wheel for just over 300 miles and then retested with the result of:
Schwalbe Ironman Tubeless - w/335 miles = .0033
Now THAT is the fastest tubeless model tire I've tested to date (I've got a bunch of tubeless tires I've been testing and I'll post a "compendium" soon), and the only one close to it is significantly wider (25C vs. 22C).
But, the real eye-opener of the group was the tubular model. Obviously, we know that the type of tire construction used (high TPI casing, latex tube, etc.) makes for a fast rolling tire. But, to be able to pull that off with a relatively thick tread cap glued on means that there must be some "magic sauce" in the tread compound. Of course, the performance of that tire also begs the question of why they just don't make an "open tubular" version of the tire for the clincher market instead of the current clincher...
So, it appears that they've done a good job on the Crr front. The clincher is on par with tires like the Michelin Pro 4s, the tubeless is pretty fast (slightly faster or slower than a Conti GP4000S, depending on miles), and the tubular is smoking fast as well. If the aerodynamics comes close to other tire models, these tires would definitely be an intriguing option for TTs and triathlons, especially for folks who plan on going pretty fast and/or in low yaw conditions (because of the relative narrowness) .
Also, as one extra data point on latex vs. butyl, I tested the clincher with a butyl tube instead and here's how it rolled:
Schwalbe Ironman Clincher (22C) = .0046
Once again, this shows that a butyl tube "costs" ~3W per tire as compared to latex...just sayin' :-)
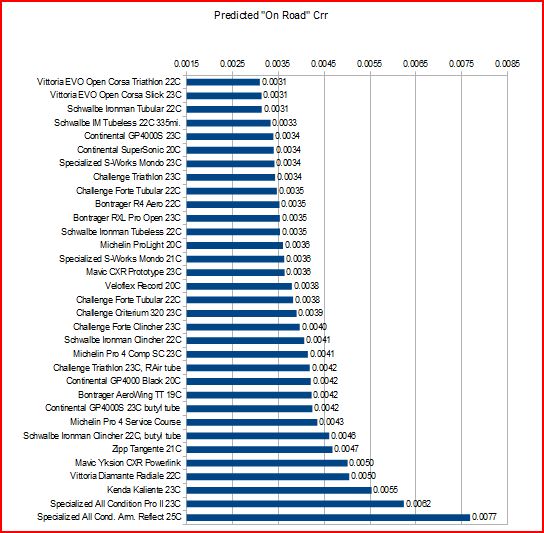
The latest overall charts:

Saturday, August 10, 2013
Even more Crr results...and another example of why Crr matters, Mavic edition
I did a short bit of roller testing yesterday. The main incentive for that was I was able to get my hands on a prototype set of the new Mavic CXR60C clincher wheels and I was itching to see how well the new CXR clincher tire rolls. Back in May I attended the press introduction for the CXR60 wheel line on behalf of Slowtwitch.com. You can see my review of the wheels at that time here: Mavic CXR60 Intro.
At the time of the press introduction, none of the attendees were able to ride the clincher version of the wheels, so a big question mark in my mind was how well the tires performed from a rolling resistance standpoint. From the wind tunnel results, obviously the wheel+tire system performed excellent in regards to aero drag, but I already had experience with the tubular CXR tires and found them to be slow...so much so that they basically "wasted" the aerodynamics. More on that later.
In any case, here's the results from yesterday's roller testing:
Mavic CXR clincher protoptype (23C) = .0036
Challenge Triathlon clincher (23C) = .0034
Challenge Triathlon w/Panaracer R'Air = .0042
Besides the Mavic tires (I tested 2 and they were nearly identical) I also tested a Challenge Triathlon clincher. Both the Mavic and the first run of the Challenge Triathlon were run with latex tubes, and then I decided to run the Challenge tire again after swapping out the latex tube for a Panaracer R'Air tube. This tube is a butyl based tube that is advertised to be compounded to be more flexible like a latex tube and I was curious to see if it made any difference in the rolling resistance. It did...but just barely (~1W for a pair @ 40 kph)...and that improvement is definitely not worth the cost of the tubes, especially considering one can get a latex tube for the same price.
The Mavic tire's Crr of .0036 is a very respectable result...much better than I was anticipating based on what I had measured for the tubular and what the Mavic engineers had claimed the difference was between the tires. By comparison, the average Crr I've measured for brand new Continental GP4000S tires is only slightly better at .0034, and is significantly better than the Michelin Pro4 Service Course Comps at .0041. Don't forget...for this testing (and the uncertainties involved) I consider anything within .0001 of Crr to be basically "tied".
At the end of the Slowtwitch.com article I linked to above, I had created a chart showing the combined affects of Crr and aero drag like I outlined in a previous blog post (Why Crr Matters...) Shown below is how that chart looks with the measured Crr for the CXR60C prototype tires.

It's fairly obvious from that chart that the CXR60C is the fastest wheel+tire system that Mavic makes. In fact, the difference for a single front wheel at an expected apparent wind velocity of 40 kph is on the order of 5-6W on average in favor of the CXR60C over both the CXR80 and the CXR60T tubular wheels.
The latest published version of the roller testing Crr spreadsheet can be found in the link at the upper right under "pages".


At the time of the press introduction, none of the attendees were able to ride the clincher version of the wheels, so a big question mark in my mind was how well the tires performed from a rolling resistance standpoint. From the wind tunnel results, obviously the wheel+tire system performed excellent in regards to aero drag, but I already had experience with the tubular CXR tires and found them to be slow...so much so that they basically "wasted" the aerodynamics. More on that later.
In any case, here's the results from yesterday's roller testing:
Mavic CXR clincher protoptype (23C) = .0036
Challenge Triathlon clincher (23C) = .0034
Challenge Triathlon w/Panaracer R'Air = .0042
Besides the Mavic tires (I tested 2 and they were nearly identical) I also tested a Challenge Triathlon clincher. Both the Mavic and the first run of the Challenge Triathlon were run with latex tubes, and then I decided to run the Challenge tire again after swapping out the latex tube for a Panaracer R'Air tube. This tube is a butyl based tube that is advertised to be compounded to be more flexible like a latex tube and I was curious to see if it made any difference in the rolling resistance. It did...but just barely (~1W for a pair @ 40 kph)...and that improvement is definitely not worth the cost of the tubes, especially considering one can get a latex tube for the same price.
The Mavic tire's Crr of .0036 is a very respectable result...much better than I was anticipating based on what I had measured for the tubular and what the Mavic engineers had claimed the difference was between the tires. By comparison, the average Crr I've measured for brand new Continental GP4000S tires is only slightly better at .0034, and is significantly better than the Michelin Pro4 Service Course Comps at .0041. Don't forget...for this testing (and the uncertainties involved) I consider anything within .0001 of Crr to be basically "tied".
At the end of the Slowtwitch.com article I linked to above, I had created a chart showing the combined affects of Crr and aero drag like I outlined in a previous blog post (Why Crr Matters...) Shown below is how that chart looks with the measured Crr for the CXR60C prototype tires.

It's fairly obvious from that chart that the CXR60C is the fastest wheel+tire system that Mavic makes. In fact, the difference for a single front wheel at an expected apparent wind velocity of 40 kph is on the order of 5-6W on average in favor of the CXR60C over both the CXR80 and the CXR60T tubular wheels.
The latest published version of the roller testing Crr spreadsheet can be found in the link at the upper right under "pages".


Monday, April 8, 2013
Why Tire Crr matters...
...and why you need to look at BOTH the aero drag of a wheel/tire combination AND the tire rolling resistance to help determine what is "fastest" (i.e. Low Crr can make up for a lot of aero "sins")
(update 04/14/13: Added Michelin Pro4 Service Course to chart after roller testing. See chart and discussion below)
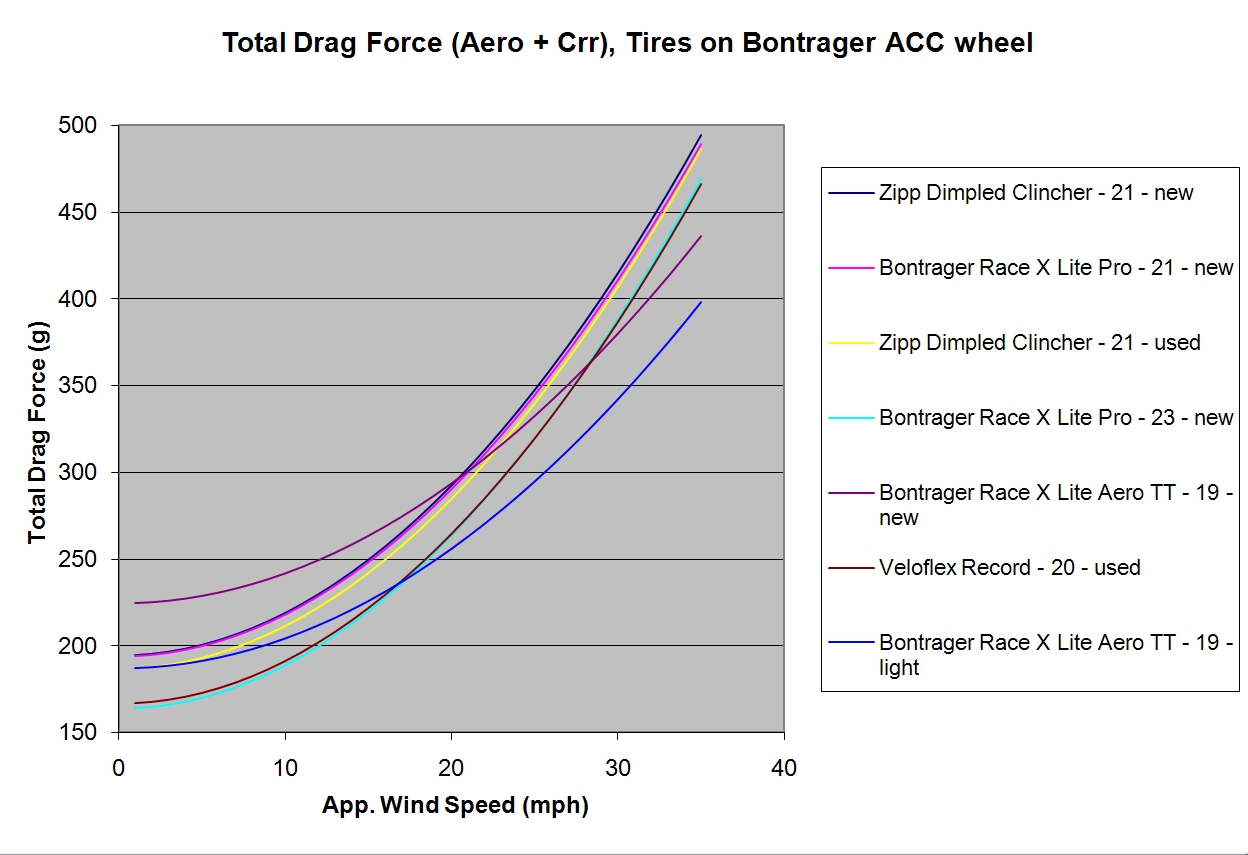
Five years ago, Damon Rinard (when he was working at Trek) made a post to the Slowtwitch triathlon forum where he described calculating a rough average of aero drag combined with rolling resistance. The data he used was from some wind tunnel testing he had done with various tires on the same rim (a Bontrager ACC - 50mm deep) and he combined this with the expected "on road" rolling resistance from roller testing. He did this because he found that different tires made a large difference in the aerodynamic drag of the wheel/tire system, and that simply choosing tires based on low rolling resistance OR low aero drag performance might not be the right approach.
I thought that was a neat approach and reverse engineered some of his data and expanded the idea to look at the effects of varying wind speed. In order to do so, I needed to scale the aero drag (taken at 30mph tunnel speed) to different apparent wind speeds using the ratio of V^2/(30mph^2) - since drag force varies with the square of wind velocity. That value was then summed with the rolling resistance force, which is constant, and then the total combined aero and rolling drag was plotted as a function of expected apparent wind speed.

Interestingly, when Trek/Bontrager released the R4 Aero tire a few years later (after Damon had left Trek to work for Vroomen/White Design) they included a plot very similar to the one I had created back in 2008:

To use that chart, you need to have an idea of what your general "race speed" is going to be and then figure out what the maximum apparent wind speed (i.e. the vector sum of the ambient wind speed at wheel level and the bike ground speed) you'll encounter. Then you can see what the average total force you'll be expecting from a particular combination. Now then, that's talking about the retarding force...if you want to know the power required for the different combinations, or the power differences between combinations, then you need to multiply the drag force value by the ground speed to get the rate of doing work (i.e. power) on that total drag force. Make sense?
One of the main takeaways from that exercise above I got was that looking at JUST aero drag or JUST Crr wasn't telling the whole story. It's very easy to "waste" a wheel/tire combination's low aero drag by using a slow rolling tire...and vice versa. But, the other takeaway I got is that really low Crr can "make up" for a lot of less than ideal aero drag performance
Well, for the plot above, the aero drag component was taken as just a simple average of the 5, 10, and 15 degree yaw angle drags. After seeing the plot below last fall (taken from the Mavic material given out at the CXR80 tire/wheel system introduction), I realized this type of estimate could be updated using a weighted average instead of a straight average. The weighting would be from the expected % time spent at each yaw angle. Obviously, we want to choose a combination based on it's performance under the conditions we expect to mostly see in our races. If we don't see large yaw angles very often, it might not be worth it to worry about differences in performance at those higher yaw angles between the equipment choices we are contemplating.

According to Mavic, the data taken above is from actual measurements (they built a "wind vane" type rig and attached it to a bike) from a large number of rides under varying conditons and courses. Although it may not represent the actual yaw angle distribution for any one particular ride (those will likely be skewed one direction or the other, depending on the course and conditions) but it does represent what one would expect over a large number of rides. As such, it should be a good tool for determining a good "all around" wheel/tire system choice.
Now then, what we need to update things further is some good aero data showing the drags at various yaw angles for different tire/wheel combinations. It would be really helpful if the data happened to be for tires which I've already roller tested and have an idea of the predicted "on road" Crr.
Well, we're in luck. The guys at Flo wheels went to the A2 tunnel last week and did just that on their new Flo30 wheel. They tested the Michelin Pro4 Service Course, the Conti GP4000S, the Bontrager R4 Aero, and the Vittoria Open Corsa EVO Tri. The last 2 were tires that I actually loaned them after Chris Thornham had contacted me asking if I knew of a good place to find the Bontrager tires. I happened to have a nearly new one handy and also offered to loan one of my Vittoria tires as well. Here's the blog post describing their tunnel visit and the aero data they took: Flo30 Aero
 As can be seen in their data, the GP4000S was the clear winner aerodynamically, with the R4 Aero close behind it. The one tire that doesn't look too hot is the Vittoria. Although it stays fairly close to the other tires up to ~7.5 degrees of yaw angle, after that the drag goes way up. However, we know from my roller testing (Crr chart) that it's Crr is slightly lower than the other 2 tires, so it might be able to make up for that, especially at lower yaw angles.
So, let's take a look. What is shown below is the result of taking a weighted average (using the Mavic probabilities for the weighting) of the drag values reported for the 3 tires that I have Crr data on (I'm working on getting a Michelin to roller test as well) combined with the Crr of each tire. I've used the values of Newtons for the drag force (since it's an actual force unit, as opposed to grams) so that the drag force results can be simply multiplied by the expected ground speed (in meters/second) to quickly calculate the power (W). (If you want to convert the values to grams, then just divide by 9.81 m/s - gravity - and multiply by 1000)

(Note: the above chart assumes a wheel loading of 38kg and represents a single front wheel)
There's some interesting things going on in that chart. To understand what's going on there, it's helpful to realize that the "steepness" of each curve is controlled by the aero drag (it varies with the square of the wind velocity), while where the line sits vertically in the chart is controlled by the rolling resistance values (a constant force).
Despite the apparently poor showing of the Vittoria EVO Tri tire aerodynamically, at lower expected apparent wind speeds it actually performs slightly better than the other 2 tires shown; up until ~27 km/hr where it's curve crosses the GP4000S curve. As compared to the R4 Aero tire, that crossover doesn't happen until expected apparent wind speeds of ~35 km/hr. At the apparent wind speeds that I expect to see during my TT'ing (~45km/hr) the GP4000S is obviously the leader, with the R4 Aero in second, but the Vittoria still has a predicted average combined drag force that's only .21N higher than the GP4000S. At the expected ground speed of ~42km/hr (i.e. 11.7 m/s), that results in a total power difference of just 2.5W. That's really not a very large amount, especially considering how much worse the Vittoria appeared to perform aerodynamically.
Now then, you might be asking "why is that?" Simply put, a lot of it has to do with the fact that the yaw angles where the largest differences in aero performance occur are also the yaw angles that are weighted less in the aero drag average due to their lower probability of being experienced. Another interesting thing is that the differences in Crr between the Vittoria tire and the other 2 isn't very large (all within .0004 of each other), but that's enough to overcome a seemingly significantly worse aero performance.
So far we've been talking about this subject in terms of races like TTs and triathlon bike legs where the front wheel is seeing "free air"...but, what about other types of bike racing? Well, when you're in a group and drafting, the apparent wind speed is going to be lower, along with the fact that the yaw angle distribution will narrow as well...and thus, that makes the Crr component all that more important. If you ever find yourself in the situation of riding up a false flat in a group while using poor rolling tires, you'll understand what I'm talking about here. Rolling resistance is actually a higher priority than wheel aerodynamics in road racing, in my humble opinion.
For one last plot, I took the data from the rest of the Flo wheels that were subsequently tested with the GP4000S tire. That plot is shown below, and as expected at lower expected apparent wind speeds, the wheels are closer together in performance than with higher expected apparent wind speed.

There we are...I hope that helps to understand some of the tradeoffs involved with choosing tires and wheels for cycling. Of course, there are other properties further involved in these sorts of tradeoffs, such as durability and "grip", but those other properties are tough to combine into a chart like the above...and so are left up to the user to weigh separately.
Update 04/14/13:
The guys at Flo were nice enough to send me the Michelin Pro4 Service Course tire used in the aero testing above and so I got a chance to run it on the rollers. The resultant Crr was .0043. They also sent the Continental GP4000S used in their testing and it rolled identically to my own version of that tire at .0034. Using that, I was able to update the Total Drag Force chart to include the Michelin on the Flo 30. The interesting thing about the curve for the Michelin is that despite it's aerodynamics being fairly close to the GP4000S and the Bontrager R4 Aero (especially with the yaw weighting) on the Total Drag Force chart it NEVER overcomes the "hit" it takes on rolling resistance, even out to expected apparent wind speeds of 60kph. Once again, the importance of Crr comes to the fore...

(update 04/14/13: Added Michelin Pro4 Service Course to chart after roller testing. See chart and discussion below)
Five years ago, Damon Rinard (when he was working at Trek) made a post to the Slowtwitch triathlon forum where he described calculating a rough average of aero drag combined with rolling resistance. The data he used was from some wind tunnel testing he had done with various tires on the same rim (a Bontrager ACC - 50mm deep) and he combined this with the expected "on road" rolling resistance from roller testing. He did this because he found that different tires made a large difference in the aerodynamic drag of the wheel/tire system, and that simply choosing tires based on low rolling resistance OR low aero drag performance might not be the right approach.
I thought that was a neat approach and reverse engineered some of his data and expanded the idea to look at the effects of varying wind speed. In order to do so, I needed to scale the aero drag (taken at 30mph tunnel speed) to different apparent wind speeds using the ratio of V^2/(30mph^2) - since drag force varies with the square of wind velocity. That value was then summed with the rolling resistance force, which is constant, and then the total combined aero and rolling drag was plotted as a function of expected apparent wind speed.
Interestingly, when Trek/Bontrager released the R4 Aero tire a few years later (after Damon had left Trek to work for Vroomen/White Design) they included a plot very similar to the one I had created back in 2008:

To use that chart, you need to have an idea of what your general "race speed" is going to be and then figure out what the maximum apparent wind speed (i.e. the vector sum of the ambient wind speed at wheel level and the bike ground speed) you'll encounter. Then you can see what the average total force you'll be expecting from a particular combination. Now then, that's talking about the retarding force...if you want to know the power required for the different combinations, or the power differences between combinations, then you need to multiply the drag force value by the ground speed to get the rate of doing work (i.e. power) on that total drag force. Make sense?
One of the main takeaways from that exercise above I got was that looking at JUST aero drag or JUST Crr wasn't telling the whole story. It's very easy to "waste" a wheel/tire combination's low aero drag by using a slow rolling tire...and vice versa. But, the other takeaway I got is that really low Crr can "make up" for a lot of less than ideal aero drag performance
Well, for the plot above, the aero drag component was taken as just a simple average of the 5, 10, and 15 degree yaw angle drags. After seeing the plot below last fall (taken from the Mavic material given out at the CXR80 tire/wheel system introduction), I realized this type of estimate could be updated using a weighted average instead of a straight average. The weighting would be from the expected % time spent at each yaw angle. Obviously, we want to choose a combination based on it's performance under the conditions we expect to mostly see in our races. If we don't see large yaw angles very often, it might not be worth it to worry about differences in performance at those higher yaw angles between the equipment choices we are contemplating.

According to Mavic, the data taken above is from actual measurements (they built a "wind vane" type rig and attached it to a bike) from a large number of rides under varying conditons and courses. Although it may not represent the actual yaw angle distribution for any one particular ride (those will likely be skewed one direction or the other, depending on the course and conditions) but it does represent what one would expect over a large number of rides. As such, it should be a good tool for determining a good "all around" wheel/tire system choice.
Now then, what we need to update things further is some good aero data showing the drags at various yaw angles for different tire/wheel combinations. It would be really helpful if the data happened to be for tires which I've already roller tested and have an idea of the predicted "on road" Crr.
Well, we're in luck. The guys at Flo wheels went to the A2 tunnel last week and did just that on their new Flo30 wheel. They tested the Michelin Pro4 Service Course, the Conti GP4000S, the Bontrager R4 Aero, and the Vittoria Open Corsa EVO Tri. The last 2 were tires that I actually loaned them after Chris Thornham had contacted me asking if I knew of a good place to find the Bontrager tires. I happened to have a nearly new one handy and also offered to loan one of my Vittoria tires as well. Here's the blog post describing their tunnel visit and the aero data they took: Flo30 Aero
 As can be seen in their data, the GP4000S was the clear winner aerodynamically, with the R4 Aero close behind it. The one tire that doesn't look too hot is the Vittoria. Although it stays fairly close to the other tires up to ~7.5 degrees of yaw angle, after that the drag goes way up. However, we know from my roller testing (Crr chart) that it's Crr is slightly lower than the other 2 tires, so it might be able to make up for that, especially at lower yaw angles.
So, let's take a look. What is shown below is the result of taking a weighted average (using the Mavic probabilities for the weighting) of the drag values reported for the 3 tires that I have Crr data on (I'm working on getting a Michelin to roller test as well) combined with the Crr of each tire. I've used the values of Newtons for the drag force (since it's an actual force unit, as opposed to grams) so that the drag force results can be simply multiplied by the expected ground speed (in meters/second) to quickly calculate the power (W). (If you want to convert the values to grams, then just divide by 9.81 m/s - gravity - and multiply by 1000)

(Note: the above chart assumes a wheel loading of 38kg and represents a single front wheel)
There's some interesting things going on in that chart. To understand what's going on there, it's helpful to realize that the "steepness" of each curve is controlled by the aero drag (it varies with the square of the wind velocity), while where the line sits vertically in the chart is controlled by the rolling resistance values (a constant force).
Despite the apparently poor showing of the Vittoria EVO Tri tire aerodynamically, at lower expected apparent wind speeds it actually performs slightly better than the other 2 tires shown; up until ~27 km/hr where it's curve crosses the GP4000S curve. As compared to the R4 Aero tire, that crossover doesn't happen until expected apparent wind speeds of ~35 km/hr. At the apparent wind speeds that I expect to see during my TT'ing (~45km/hr) the GP4000S is obviously the leader, with the R4 Aero in second, but the Vittoria still has a predicted average combined drag force that's only .21N higher than the GP4000S. At the expected ground speed of ~42km/hr (i.e. 11.7 m/s), that results in a total power difference of just 2.5W. That's really not a very large amount, especially considering how much worse the Vittoria appeared to perform aerodynamically.
Now then, you might be asking "why is that?" Simply put, a lot of it has to do with the fact that the yaw angles where the largest differences in aero performance occur are also the yaw angles that are weighted less in the aero drag average due to their lower probability of being experienced. Another interesting thing is that the differences in Crr between the Vittoria tire and the other 2 isn't very large (all within .0004 of each other), but that's enough to overcome a seemingly significantly worse aero performance.
So far we've been talking about this subject in terms of races like TTs and triathlon bike legs where the front wheel is seeing "free air"...but, what about other types of bike racing? Well, when you're in a group and drafting, the apparent wind speed is going to be lower, along with the fact that the yaw angle distribution will narrow as well...and thus, that makes the Crr component all that more important. If you ever find yourself in the situation of riding up a false flat in a group while using poor rolling tires, you'll understand what I'm talking about here. Rolling resistance is actually a higher priority than wheel aerodynamics in road racing, in my humble opinion.
For one last plot, I took the data from the rest of the Flo wheels that were subsequently tested with the GP4000S tire. That plot is shown below, and as expected at lower expected apparent wind speeds, the wheels are closer together in performance than with higher expected apparent wind speed.

There we are...I hope that helps to understand some of the tradeoffs involved with choosing tires and wheels for cycling. Of course, there are other properties further involved in these sorts of tradeoffs, such as durability and "grip", but those other properties are tough to combine into a chart like the above...and so are left up to the user to weigh separately.
Update 04/14/13:
The guys at Flo were nice enough to send me the Michelin Pro4 Service Course tire used in the aero testing above and so I got a chance to run it on the rollers. The resultant Crr was .0043. They also sent the Continental GP4000S used in their testing and it rolled identically to my own version of that tire at .0034. Using that, I was able to update the Total Drag Force chart to include the Michelin on the Flo 30. The interesting thing about the curve for the Michelin is that despite it's aerodynamics being fairly close to the GP4000S and the Bontrager R4 Aero (especially with the yaw weighting) on the Total Drag Force chart it NEVER overcomes the "hit" it takes on rolling resistance, even out to expected apparent wind speeds of 60kph. Once again, the importance of Crr comes to the fore...

Friday, April 5, 2013
More Roller Testing Results
Well, I happened to recently acquire a Continental GP4000S tire for a very reasonable price, and in light of the recent Flo aero testing, I decided it would be a good time to throw it on the rollers and see how it does. I also had a couple of well used "training/all condition" tires a friend loaned me so I tested those as well. Wow...some of those training tires REALLY sap the power!
Anyway, here's the predicted on-road Crr for the 3 tires I tested today:
Continental GP4000S 23C = .0034
Specialized All Condition Pro II 23C = .0062
Specialized All Condition Armadillo Reflect 25C = .0077
The overall Crr chart now looks like this:

And here is the predicted power for 2 tires at 40kph (85kg total load):

As always, the entire spreadsheet is saved here: Crr Spreadsheet
Anyway, here's the predicted on-road Crr for the 3 tires I tested today:
Continental GP4000S 23C = .0034
Specialized All Condition Pro II 23C = .0062
Specialized All Condition Armadillo Reflect 25C = .0077
The overall Crr chart now looks like this:

And here is the predicted power for 2 tires at 40kph (85kg total load):

As always, the entire spreadsheet is saved here: Crr Spreadsheet
Tuesday, February 19, 2013
Tire Crr Testing on Rollers - The Chart..and a "how to"

In my last post I outlined the "math behind the madness" of testing the rolling resistance of bike tires on home rollers. In this one, I'll be showing the results of some of that testing I've personally done over the past year or so. I'll also go through a few tips and tricks I've learned in doing this sort of testing...just in case anyone else is crazy enough to try some of this potentially mind numbing testing.
OK, I know a few of you are out there are "champing at the bit" to see the results, so without any further ado, here's a chart showing my estimates for the power to roll a pair of various tires I've tested (on a "real road" and for an 85kg bike plus rider mass):

Here's the same chart, but showing the estimated "on road" Crr values:
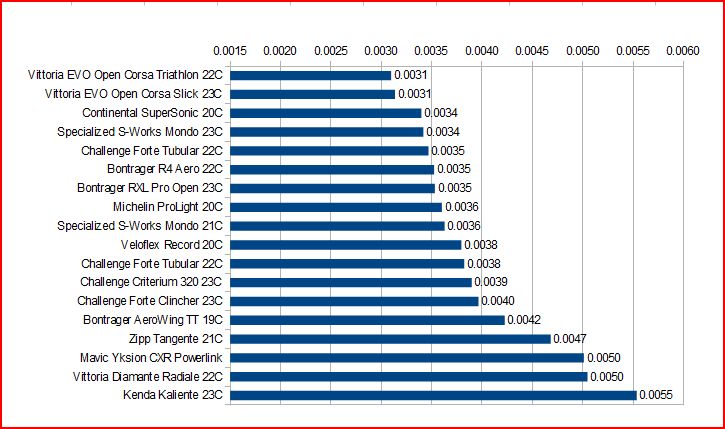
As can be seen, that's a fairly wide range of power requirements. The wrong tire choice can easily "cost" a rider 10-15W of power to go a given speed. When choosing tires, I commonly think of a scene from "Indiana Jones and the Last Crusade" where the Templar Knight guarding the Holy Grail says "...you must choose, but choose wisely...". After all, when you're done with a race and you lose by seconds, or inches...you would hate to have the following be said about your tire choice:
The Setup:
OK, now that we've got that all out of the way, I thought I'd describe a bit about the setup I use for doing this sort of testing. As you can see in the pic at the top of this blog post, it's a fairly simple affair consisting of a set of 4.5" diameter Kreitler rollers, a front fork stand, and a bike equipped with a power meter (and a power meter head unit). That's really basically it. A couple of other pieces of equipment that are crucial for getting consistent results, in my experience, are:
- A means to measure ambient temperature
- A means to measure rear wheel load
- A separate speed sensor and magnet (NOT on the wheel, but on the roller - see below)
- A notebook and pen

Now then, let's talk about the speed sensor I mentioned above. One of the most important things to get an accurate measure of in this testing is the actual "ground speed" during the test. This can be done with a wheel mounted magnet and speed sensor, BUT that requires determining and changing the wheel rollout number for EACH tire tested. In my experience, that can be a bit problematic...especially due to the curved contact patch that is present on the rollers. It's very hard to get an accurate and consistent measure of wheel rollout that way. To solve that problem, I realized that instead of triggering a speed sensor on the wheel, I could instead attach a magnet to the end of one of the rear drums and then use a speed sensor triggering off of the drum. All I needed to do was to carefully measure the diameter of the metal drum (which will NOT be changing from test to test) and use THAT as the ground speed measurement for the testing. Here's what that looks like:

That's just a small rare-earth magnet attached to the end cap of the roller with double-sided tape, and a Garmin ANT+ speed/cadence sensor taped to the roller frame.
Lastly, the notebook and pen are where I write down the date, what tire I'm testing, the size, the ambient temps during the testing, the power meter zero offset numbers, and the actual measured tire width as mounted.
The Protocol:
Alright, so everything is set up and we've gathered all the stuff needed. What's next? How do I do this? Well, here's a quick rundown of how I go about doing a tire Crr test (in "10 easy steps"!) This isn't the only way to do it, but it's how I've settled on things after doing this testing for a while:
- Mount the tire on the test wheel - Most of my testing is done with my old yellow-cap PT wheel with a Mavic Open Pro rim. I started out testing with this wheel in order to get both a hub and crank power to determine the level of typical drivetrain losses in the setup. I wanted to know that for the occasions when I would be testing tires (such as tubulars) which I couldn't mount to the clincher PT wheel. Since I'm mainly interested in tires for time trials and road racing, I'll test them using a latex inner tube. Testing by others has shown that using a butyl tube can cause 10-15% higher Crr than with latex.
- Pump the tire to the test pressure - What pressure to use is really up to you. I chose to do all of my testing with 120psi. The reason I chose that value was mainly so that I could compare my results more easily to the results of others, most notably the testing done by Al Morrison. Understand that on a perfectly smooth surface, the higher the pressure you pump tire up to, the lower the measured power requirements will be...however, that will only be true on the rollers, or on flat surfaces that are just as smooth. On "real roads", i.e. roads with typical roughness, that isn't necessarily the case and there will tend to be a pressure above which higher pressures actually will make you slower overall. Anyway, the key here is to pick a pressure and stick with it through your testing so that you are comparing tires on an equivalent basis.
- Place the wheel in the test bike - Install the rear wheel in the test bike and place the chain in the chosen gear for the testing. I do my testing in a 53x13 gear for consistency. If it's not in there already, install the fork into the fork mount.
- Measure the rear wheel load - This is done how I described above. I'll usually only do this once during a session, and for me I've found it's typically within a pound or two each time (my body weight tends to be fairly stable). This doesn't seem to be a super-critical measurement either, since a 1 or 2 lb. difference will only result in ~1-2% error in the final calculation.
- Place rollers under rear wheel - At this point, move the scale out from under the rear wheel and slide in the rollers. To get a consistent placement of the rear wheel on the rollers, I'll lift the fork mount slightly off the ground while I allow the rear wheel to spin as it touches the 2 rollers and then I carefully place the fork mount on the ground.
- Climb on board - It's now time to saddle up. I usually approach the bike from the non-drive side and put my left foot on the pedal and then carefully swing my right leg over taking care not to disturb anything in the setup. I'll then spin the cranks to make sure the PM is awake and the speed reading is working, at which point I'll clip out and zero the PM through the head unit. I'll note the offset value (from my Quarq) in the notebook along with the ambient temperature.
- Tire warmup - Now it's time to warm up the tire to working temperature. Since my tests are done at 90 rpm (I find it's easier to hold a consistent rpm rather than focusing on the wheel speed) I'll warm up the tire at 95 rpm for 5 minutes. At the end of the 5 minutes, I'll stop and quickly check the PM zero offset and write the value down in my notebook along with the ambient temperature reading.
- The Test - Now it's time for the test. I'll bring the cadence up to 90 rpms and once that is steady, I'll start a 4 minute interval in the PM head unit. I'll concentrate on keeping a steady cadence through the whole interval, trying to be especially steady through the final 2 minutes since that is the section of the data I take the average power and ground speed from. At the end of the 4 minute test interval, I'll again note the PM offset (to make sure it hasn't moved appreciably during the test for some reason) and write down the ambient test. That's it. Test over...either I stop there, or if I have more to tires to test, I'll start back at step one (skipping the load measurement for repeat tests) and on through the remaining steps.
- Download Data - Now it's time to get the average power and ground speed values from the head unit. I'll typically load the file into Golden Cheetah and then highlight the final 2 minutes of each test session and read off the averages as calculated.
- Calculate the Crr - The final step is to take the average power and speed values, along with the wheel load and ambient temperature taken at the end of the test interval into a spreadsheet I've written to quickly do the calculations. I've loaded the spreadsheet onto Google Drive and it can be accessed here: Crr Spreadsheet
- After doing a number of runs using both the crank-based power meter and the PT wheel, I was consistently finding that for the gearing chosen and the lower power levels (typically 50-100W) seen on the 4.5" rollers, the drivetrain losses were on the order of 5%. That's the value I enter in the spreadsheet.
- I did a fair number of runs with the exact same tire and at different ambient temperatures to determine what I should use as the temperature compensation value. In my case, I found it to be ~1.36% change per deg C (lower Crr with higher temperatures). Here's the plot of those tests:

- I normalize the Crr values to 20C. If you want to know what the Crr would be at various temperatures, you can just enter those temperatures into the appropriate cell on the first sheet of the spreadsheet.
- Added 2/19/12 - I realized I forgot to point out that I use a "smooth to real road" factor of 1.5X to account for the higher energy dissipation requirements of typical road roughness. This value is based on comparisons of roller based Crr measurements ("translated" to flat surface) and actual "on road" Crr derived from field tests and other means (i.e. iAero coast down values) for the same tires.
Well...that's about all I can think of for now. Hopefully that will help encourage others to give this a try. It's really not that difficult to do and is a good way to help you to "choose wisely" when it comes to tires for your "go fast" bike setup.
Saturday, February 9, 2013
Tire Crr testing on Rollers - The Math
I've been doing a little bit of tire testing lately. But, before I reveal any results, I thought it would be good to go over some math. I know, I know...(I can hear the groans already), but I think it's important to review so people understand why it's reasonable to equate power to move a tire on a roller to power on flat ground.
It's long been known that bicycle rollers act as a sort of rolling resistance "amplifier". In other words, the differences in the rolling resistance between tires is magnified when riding on the rollers. It's usually a fairly subtle thing to try to "feel" the difference in rolling resistance in tires when riding outside, but it's pretty easy to tell the fast tires from the slow tires on rollers just by the exaggerated effort it takes. But, the question has long been "how much" of an amplifier are they? Well, back in 2006 I was discussing this with a few folks and realized that the equations to make that comparison between rollers and a flat surface Crr (Coefficient of rolling resistance) were already available...they just needed to be combined. Then, it was pointed out to me that the particular geometry of a typical roller setup needed to be accounted for as well. The normal "dual roller" setup on the rear of a roller set results in a geometric effect that actually increases the normal force on each roller. In other words, you can't just take the rear wheel load as if it was a single roller. So, I added that to the equations as well.
Anyway, what you see below is the short "paper" I sketched up back then on the subject:
Flat Surface RR from
Roller Testing – Tom Anhalt – 5/2/06
The power required to turn a wheel on a
drum at a specific speed is governed by the equation:
PDrum =
CrrDrum x VDrum x M x g (a)
Where,
PDrum = Power required to
turn drum (Watts)
CrrDrum = Coefficient of
Rolling Resistance of the tire on the drum (unitless)
VDrum = The tangential
velocity of the drum (m/s)
M = The mass load of the wheel on the
drum (kg)
g = gravitational constant = 9.81 m/s2
Rearranging equation (a) to solve for
the Crr of the tire on the drum results in:
CrrDrum = PDrum
/ (VDrum x M x g) (b)
Then the contact patch deformation of a
tire of a specific diameter and a roller of a specific diameter can
be equated to the deformation of an equivalent diameter tire on a
flat surface using the following equation [Bicycling Science, 3rd
edition, pg 211]:
1/req = 1/r1
+ 1/r2 (c)
Where,
req = equivalent wheel
radius
r1 = tested wheel radius
r2 = tested drum radius
For convenience purposes, this equation
can be rewritten using the appropriate diameters (r x 2) and is then:
1/Deq =
1/Dwheel + 1/DDrum (d)
For a tire of a given construction, it
has been shown that the Crr varies inversely proportionally to the
wheel radius, and thus the wheel diameter, in the range of Dwheel0.66
to Dwheel0.75 [Bicycling Science, 3rd
edition, pg. 226]. To simplify for this purpose, the assumption is
made that the Crr varies inversely proportionally to Dwheel0.7
From this, it can be then written that:
Crrflat /
CrrDrum = Deq0.7 / Dwheel0.7
(e)
Equation (e) can be combined with (d)
and rearranged to give:
Crrflat =
CrrDrum x [ 1 / (1 + Dwheel/DDrum)]0.7
(f)
Substituting equation (b) for CrrDrum
in equation (f) results in:
Crrflat
= [PDrum / (VDrum x
M x g)] x [ 1 / (1 + Dwheel/DDrum)]0.7
(g)
Mass Correction Factor:
When doing Crr testing on rollers, the
mass loading of the wheel or wheels will need to be corrected due to
front-rear loading ratio and the fact that 2 offset rollers contact
the rear wheel, thereby increasing the normal force on the rollers
due to geometry effects.
Rear Wheel Only Case - When the
test is done using a front fork mount and only the rear wheel
contacting the rear rollers of the test setup, the following
“effective mass” (Meff) needs to be calculated and
substituted for M in equation (g) :
Meff = Mrear
/ cos [arcsin (X/(Dwheel + DDrum))] (h)
Where:
X = separation distance of rear roller
axles (consistent units with Dwheel and DDrum)
Mrear = vertical mass load
on rear wheel (kg)
Front and Rear Rollers - When
the test is performed using both the front and rear rollers, the
following Meff needs to be calculated and substituted for M in
equation (g) :
Meff = Mfront
+ Mrear / cos [arcsin (X/(Dwheel + DDrum))]
(i)
Where:
Mfront = vertical mass load
on the front wheel (kg)
Power Correction:
Depending on the method of power
measurement, the following offsets can be used to account for
drivetrain and drum rotation losses in the calculation of PDrum
for use in equation (g):
For Powertap - PDrum
= PPowertap – 5W (accounts for drum bearing losses)
(j)
For SRM - PDrum =
PSRM – 15W (accounts for drum bearings and driveline
losses) (k)
Where:
PPowertap and PSRM
are the power readouts (W) from the appropriate power meters.
These power offsets are somewhat
arbitrary and should be modified if better data is known about the
particular test setup.
That's basically it. I'd like to note a couple things about the last section on "Power Correction". First, after doing a bunch of testing since then, I don't bother accounting for the drum bearing losses. Also, when using a crank-based power meter, like an SRM or a Quarq Cinqo, I've found (after using a PT in conjunction for quite a few tests) that it makes more sense to account for the drivetrain friction with just a straight percentage. A typical value taken for drivetrain losses on bicycles is ~2.5%, but that is typical at higher power levels (i.e. higher chain tensions). For the lower power levels I usually see in tire testing with a rear only roller setup (usually ~100W or less, with the better tires closer to ~50W) I typically see ~5% drivetrain losses, so that's the figure I use.
It's important to remember that the point of this is to get a "ballpark" feel for the difference between tires, not necessarily an absolutely accurate value. It's been shown that percent difference in power requirements on the rollers equate very well to percent differences on the road. What we're really looking for is a sort of "scaling factor" to put the differences seen on the rollers in perspective as to what to expect on the road.
There you go...equation (g) is easily written into a spreadsheet. After that, it just takes a few measurements of the roller setup, weighing the rear wheel load, and some time on the rollers with a power meter equipped bike and nearly anyone can "test tires".
Subscribe to:
Posts (Atom)