Tuesday, February 19, 2013

Tire Crr Testing on Rollers - The Chart..and a "how to"


In my last post I outlined the "math behind the madness" of testing the rolling resistance of bike tires on home rollers. In this one, I'll be showing the results of some of that testing I've personally done over the past year or so. I'll also go through a few tips and tricks I've learned in doing this sort of testing...just in case anyone else is crazy enough to try some of this potentially mind numbing testing.

OK, I know a few of you are out there are "champing at the bit" to see the results, so without any further ado, here's a chart showing my estimates for the power to roll a pair of various tires I've tested (on a "real road" and for an 85kg bike plus rider mass):


Here's the same chart, but showing the estimated "on road" Crr values:
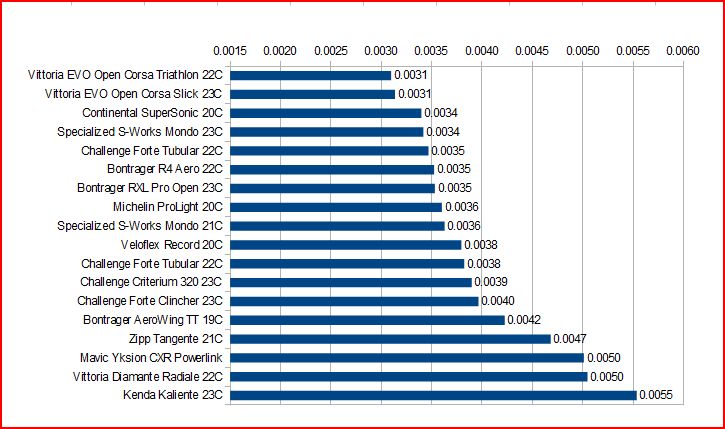
As can be seen, that's a fairly wide range of power requirements.  The wrong tire choice can easily "cost" a rider 10-15W of power to go a given speed.  When choosing tires, I commonly think of a scene from "Indiana Jones and the Last Crusade" where the Templar Knight guarding the Holy Grail says "...you must choose, but choose wisely...".  After all, when you're done with a race and you lose by seconds, or inches...you would hate to have the following be said about your tire choice:


The Setup:

OK, now that we've got that all out of the way, I thought I'd describe a bit about the setup I use for doing this sort of testing.  As you can see in the pic at the top of this blog post, it's a fairly simple affair consisting of a set of 4.5" diameter Kreitler rollers, a front fork stand, and a bike equipped with a power meter (and a power meter head unit).  That's really basically it.  A couple of other pieces of equipment that are crucial for getting consistent results, in my experience, are:
  • A means to measure ambient temperature
  • A means to measure rear wheel load
  • A separate speed sensor and magnet (NOT on the wheel, but on the roller - see below)
  • A notebook and pen
For measuring the ambient air temps during the test, I use my trusty Brunton ADC Summit, which I place at about axle level somewhere near the side of the rear wheel of the bike during the testing.


To measure the rear wheel load of the setup, I actually just use a digital bathroom scale which I've checked against known weights and typically is within 0.5 lbs of the actual weight.  In order to make that rear wheel load measurement, I mount the fork in the fork stand, and in stead of placing the rear wheel on the rollers, I stack the scale on top of some wood scraps and place the rear tire on the scale.  I stack it so that the rear axle is the same height off the ground as it would be on the rollers.  As it turns out, a couple of scrap pieces of 3" square wooden post and the thickness of my scale put that measurement to within 1/4" of what it is on the rollers.  Perfect.

Now then, let's talk about the speed sensor I mentioned above.  One of the most important things to get an accurate measure of in this testing is the actual "ground speed" during the test.  This can be done with a wheel mounted magnet and speed sensor, BUT that requires determining and changing the wheel rollout number for EACH tire tested.  In my experience, that can be a bit problematic...especially due to the curved contact patch that is present on the rollers.  It's very hard to get an accurate and consistent measure of wheel rollout that way.  To solve that problem, I realized that instead of triggering a speed sensor on the wheel, I could instead attach a magnet to the end of one of the rear drums and then use a speed sensor triggering off of the drum.  All I needed to do was to carefully measure the diameter of the metal drum (which will NOT be changing from test to test) and use THAT as the ground speed measurement for the testing.  Here's what that looks like:


That's just a small rare-earth magnet attached to the end cap of the roller with double-sided tape, and a Garmin ANT+ speed/cadence sensor taped to the roller frame.

Lastly, the notebook and pen are where I write down the date, what tire I'm testing, the size, the ambient temps during the testing, the power meter zero offset numbers, and the actual measured tire width as mounted.


The Protocol:

Alright, so everything is set up and we've gathered all the stuff needed.  What's next?  How do I do this? Well, here's a quick rundown of how I go about doing a tire Crr test (in "10 easy steps"!) This isn't the only way to do it, but it's how I've settled on things after doing this testing for a while:
  1. Mount the tire on the test wheel - Most of my testing is done with my old yellow-cap PT wheel with a Mavic Open Pro rim.  I started out testing with this wheel in order to get both a hub and crank power to determine the level of typical drivetrain losses in the setup.  I wanted to know that for the occasions when I would be testing tires (such as tubulars) which I couldn't mount to the clincher PT wheel. Since I'm mainly interested in tires for time trials and road racing, I'll test them using a latex inner tube.  Testing by others has shown that using a butyl tube can cause 10-15% higher Crr than with latex.
  2. Pump the tire to the test pressure - What pressure to use is really up to you.  I chose to do all of my testing with 120psi.  The reason I chose that value was mainly so that I could compare my results more easily to the results of others, most notably the testing done by Al Morrison.  Understand that on a perfectly smooth surface, the higher the pressure you pump tire up to, the lower the measured power requirements will be...however, that will only be true on the rollers, or on flat surfaces that are just as smooth.  On "real roads", i.e. roads with typical roughness, that isn't necessarily the case and there will tend to be a pressure above which higher pressures actually will make you slower overall.  Anyway, the key here is to pick a pressure and stick with it through your testing so that you are comparing tires on an equivalent basis.  
  3. Place the wheel in the test bike - Install the rear wheel in the test bike and place the chain in the chosen gear for the testing.  I do my testing in a 53x13 gear for consistency. If it's not in there already, install the fork into the fork mount.
  4. Measure the rear wheel load - This is done how I described above.  I'll usually only do this once during a session, and for me I've found it's typically within a pound or two each time (my body weight tends to be fairly stable).  This doesn't seem to be a super-critical measurement either, since a 1 or 2 lb. difference will only result in ~1-2% error in the final calculation.
  5. Place rollers under rear wheel - At this point, move the scale out from under the rear wheel and slide in the rollers. To get a consistent placement of the rear wheel on the rollers, I'll lift the fork mount slightly off the ground while I allow the rear wheel to spin as it touches the 2 rollers and then I carefully place the fork mount on the ground.
  6. Climb on board - It's now time to saddle up.  I usually approach the bike from the non-drive side and put my left foot on the pedal and then carefully swing my right leg over taking care not to disturb anything in the setup.  I'll then spin the cranks to make sure the PM is awake and the speed reading is working, at which point I'll clip out and zero the PM through the head unit.  I'll note the offset value (from my Quarq) in the notebook along with the ambient temperature.
  7. Tire warmup - Now it's time to warm up the tire to working temperature.  Since my tests are done at 90 rpm (I find it's easier to hold a consistent rpm rather than focusing on the wheel speed) I'll warm up the tire at 95 rpm for 5 minutes.  At the end of the 5 minutes, I'll stop and quickly check the PM zero offset and write the value down in my notebook along with the ambient temperature reading.
  8. The Test - Now it's time for the test.  I'll bring the cadence up to 90 rpms and once that is steady, I'll start a 4 minute interval in the PM head unit.  I'll concentrate on keeping a steady cadence through the whole interval, trying to be especially steady through the final 2 minutes since that is the section of the data I take the average power and ground speed from.  At the end of the 4 minute test interval, I'll again note the PM offset (to make sure it hasn't moved appreciably during the test for some reason) and write down the ambient test.  That's it.  Test over...either I stop there, or if I have more to tires to test, I'll start back at step one (skipping the load measurement for repeat tests) and on through the remaining steps.
  9. Download Data - Now it's time to get the average power and ground speed values from the head unit.  I'll typically load the file into Golden Cheetah and then highlight the final 2 minutes of each test session and read off the averages as calculated.
  10. Calculate the Crr - The final step is to take the average power and speed values, along with the wheel load and ambient temperature taken at the end of the test interval into a spreadsheet I've written to quickly do the calculations.  I've loaded the spreadsheet onto Google Drive and it can be accessed here: Crr Spreadsheet
Other Notes:
  • After doing a number of runs using both the crank-based power meter and the PT wheel, I was consistently finding that for the gearing chosen and the lower power levels (typically 50-100W) seen on the 4.5" rollers, the drivetrain losses were on the order of 5%.  That's the value I enter in the spreadsheet.
  • I did a fair number of runs with the exact same tire and at different ambient temperatures to determine what I should use as the temperature compensation value.  In my case, I found it to be ~1.36% change per deg C (lower Crr with higher temperatures).  Here's the plot of those tests:

  • I normalize the Crr values to 20C.  If you want to know what the Crr would be at various temperatures, you can just enter those temperatures into the appropriate cell on the first sheet of the spreadsheet.
  • Added 2/19/12 - I realized I forgot to point out that I use a "smooth to real road" factor of 1.5X to account for the higher energy dissipation requirements of typical road roughness.  This value is based on comparisons of roller based Crr measurements ("translated" to flat surface) and actual "on road" Crr derived from field tests and other means (i.e. iAero coast down values) for the same tires.

Well...that's about all I can think of for now.  Hopefully that will help encourage others to give this a try.  It's really not that difficult to do and is a good way to help you to "choose wisely" when it comes to tires for your "go fast" bike setup.

Saturday, February 9, 2013

Tire Crr testing on Rollers - The Math


I've been doing a little bit of tire testing lately.  But, before I reveal any results, I thought it would be good to go over some math.  I know, I know...(I can hear the groans already), but I think it's important to review so people understand why it's reasonable to equate power to move a tire on a roller to power on flat ground.  

It's long been known that bicycle rollers act as a sort of rolling resistance "amplifier".  In other words, the differences in the rolling resistance between tires is magnified when riding on the rollers.  It's usually a fairly subtle thing to try to "feel" the difference in rolling resistance in tires when riding outside, but it's pretty easy to tell the fast tires from the slow tires on rollers just by the exaggerated effort it takes.  But, the question has long been "how much" of an amplifier are they? Well, back in 2006 I was discussing this with a few folks and realized that the equations to make that comparison between rollers and a flat surface Crr (Coefficient of rolling resistance) were already available...they just needed to be combined.  Then, it was pointed out to me that the particular geometry of a typical roller setup needed to be accounted for as well.  The normal "dual roller" setup on the rear of a roller set results in a geometric effect that actually increases the normal force on each roller.  In other words, you can't just take the rear wheel load as if it was a single roller. So, I added that to the equations as well.

Anyway, what you see below is the short "paper" I sketched up back then on the subject:

Flat Surface RR from Roller Testing – Tom Anhalt – 5/2/06


The power required to turn a wheel on a drum at a specific speed is governed by the equation:


PDrum = CrrDrum x VDrum x M x g (a)


Where,

PDrum = Power required to turn drum (Watts)

CrrDrum = Coefficient of Rolling Resistance of the tire on the drum (unitless)

VDrum = The tangential velocity of the drum (m/s)

M = The mass load of the wheel on the drum (kg)

g = gravitational constant = 9.81 m/s2


Rearranging equation (a) to solve for the Crr of the tire on the drum results in:


CrrDrum = PDrum / (VDrum x M x g) (b)


Then the contact patch deformation of a tire of a specific diameter and a roller of a specific diameter can be equated to the deformation of an equivalent diameter tire on a flat surface using the following equation [Bicycling Science, 3rd edition, pg 211]:


1/req = 1/r1 + 1/r2 (c)


Where,

req = equivalent wheel radius

r1 = tested wheel radius

r2 = tested drum radius


For convenience purposes, this equation can be rewritten using the appropriate diameters (r x 2) and is then:


1/Deq = 1/Dwheel + 1/DDrum (d)


For a tire of a given construction, it has been shown that the Crr varies inversely proportionally to the wheel radius, and thus the wheel diameter, in the range of Dwheel0.66 to Dwheel0.75 [Bicycling Science, 3rd edition, pg. 226]. To simplify for this purpose, the assumption is made that the Crr varies inversely proportionally to Dwheel0.7


From this, it can be then written that:


Crrflat / CrrDrum = Deq0.7 / Dwheel0.7 (e)


Equation (e) can be combined with (d) and rearranged to give:


Crrflat = CrrDrum x [ 1 / (1 + Dwheel/DDrum)]0.7 (f)


Substituting equation (b) for CrrDrum in equation (f) results in:


Crrflat = [PDrum / (VDrum x M x g)] x [ 1 / (1 + Dwheel/DDrum)]0.7 (g)


Mass Correction Factor:


When doing Crr testing on rollers, the mass loading of the wheel or wheels will need to be corrected due to front-rear loading ratio and the fact that 2 offset rollers contact the rear wheel, thereby increasing the normal force on the rollers due to geometry effects.


Rear Wheel Only Case - When the test is done using a front fork mount and only the rear wheel contacting the rear rollers of the test setup, the following “effective mass” (Meff) needs to be calculated and substituted for M in equation (g) :


Meff = Mrear / cos [arcsin (X/(Dwheel + DDrum))] (h)


Where:

X = separation distance of rear roller axles (consistent units with Dwheel and DDrum)

Mrear = vertical mass load on rear wheel (kg)


Front and Rear Rollers - When the test is performed using both the front and rear rollers, the following Meff needs to be calculated and substituted for M in equation (g) :


Meff = Mfront + Mrear / cos [arcsin (X/(Dwheel + DDrum))] (i)


Where:

Mfront = vertical mass load on the front wheel (kg)


Power Correction:


Depending on the method of power measurement, the following offsets can be used to account for drivetrain and drum rotation losses in the calculation of PDrum for use in equation (g):


For Powertap - PDrum = PPowertap – 5W (accounts for drum bearing losses) (j)


For SRM - PDrum = PSRM – 15W (accounts for drum bearings and driveline losses) (k)


Where:

PPowertap and PSRM are the power readouts (W) from the appropriate power meters.


These power offsets are somewhat arbitrary and should be modified if better data is known about the particular test setup.


That's basically it.  I'd like to note a couple things about the last section on "Power Correction".  First, after doing a bunch of testing since then, I don't bother accounting for the drum bearing losses.  Also, when using a crank-based power meter, like an SRM or a Quarq Cinqo, I've found (after using a PT in conjunction for quite a few tests) that it makes more sense to account for the drivetrain friction with just a straight percentage.  A typical value taken for drivetrain losses on bicycles is ~2.5%, but that is typical at higher power levels (i.e. higher chain tensions).  For the lower power levels I usually see in tire testing with a rear only roller setup (usually ~100W or less, with the better tires closer to ~50W) I typically see ~5% drivetrain losses, so that's the figure I use.

It's important to remember that the point of this is to get a "ballpark" feel for the difference between tires, not necessarily an absolutely accurate value.  It's been shown that percent difference in power requirements on the rollers equate very well to percent differences on the road.  What we're really looking for is a sort of "scaling factor" to put the differences seen on the rollers in perspective as to what to expect on the road.

There you go...equation (g) is easily written into a spreadsheet.  After that, it just takes a few measurements of the roller setup, weighing the rear wheel load, and some time on the rollers with a power meter equipped bike and nearly anyone can "test tires".


Friday, February 1, 2013

LeMond Power Pilot - Does it give good numbers?


Considering that it was announced today that Greg LeMond had formed a new venture to sell the Revolution trainer, and that my last post had dealt with the Revolution, I thought it would be a good time to also talk about the Power Pilot device that LeMond sells for use with the trainerIf someone already has a non-wheel based power meter on their bike, then the Power Pilot would be a bit redundant.  But, for those who use a PT wheel primarily, or don't have another form of power measurement, the Power Pilot could be a good alternative for determining the "load" during a trainer workout.  The following is a brief look at the power reporting and recording performance of the LeMond Power Pilot. In particular, it is compared to the output of a “known good” Quarq CinQo crank-based power meter.  "Known good" in this sense is a power meter which has had it's torque slope checked and adjusted and has a zero offset that is stable.


BACKGROUND

The LeMond Power Pilot is a device designed to be used in conjunction with the LeMond Revolution trainer to primarily monitor and record the training efforts of the rider. The Revolution trainer is a high inertia wind trainer with the somewhat unique configuration whereby the rear wheel of the attached bike is removed and is not a part of the driven assembly. The chain of the bike drives a rear cassette which is attached to a relatively high mass flywheel through a belt drive gear reduction system. In my last blog post ("What's the Virtual CdA and Crr of the LeMond Revolution Trainer"), it was shown that this system “mimics” the aero drag of a typical sized rider on a road bike (CdA = ~0.35 m^2) and the rolling resistance of average tires (Crr = ~ .005). The inertial mass was also found to be equivalent to a rider mass of ~45kg, which although it is less than the mass of a typical rider, it is far higher than the much lower inertial masses of most indoor trainers on the market today. This accounts for the often reported excellent “road feel” of the Revolution trainer.


The Power Pilot uses an ANT+ sensor to read the drive pulley rotational velocity, and by extension, the flywheel speed during operation. Along with the known aero properties of the flywheel fan, the aero drag power is calculated using that speed measurement and an estimate of the air density (based upon the user entered altitude, an internal temperature sensor, and an internal humidity sensor.) The speed sensor is also used to determine the acceleration/deceleration of the flywheel mass to account for that in the power reporting. Additionally, the Power Pilot firmware allows for a coastdown calibration to be performed which then accounts for any unit to unit variation in the “fixed” losses of the mechanism.


THE TEST AND RESULTS

In order to determine how well the Power Pilot performs these calculations, it was decided to compare the Power Pilot output to the power values measured using a Quarq CinQo crank-based power meter. The particular CinQo used in this testing is a “known good” unit which has been recently calibrated for torque slope and demonstrates a very stable zero offset. To make the comparison, a ride was undertaken whereby a “cassette sweep” was performed. The ride started with the bike in a gear selection of 53/25 and then progressed down the cassette every ~1.5 minutes until a gear selection of 53/12 was used, all the while keeping a constant 60 rpm cadence. Then, the chainring was shifted to a 39T and the progression was repeated partially up the cassette. Finally, two additional runs were taken at a higher cadence (and thus power). A plot of both power traces vs. time is shown below:


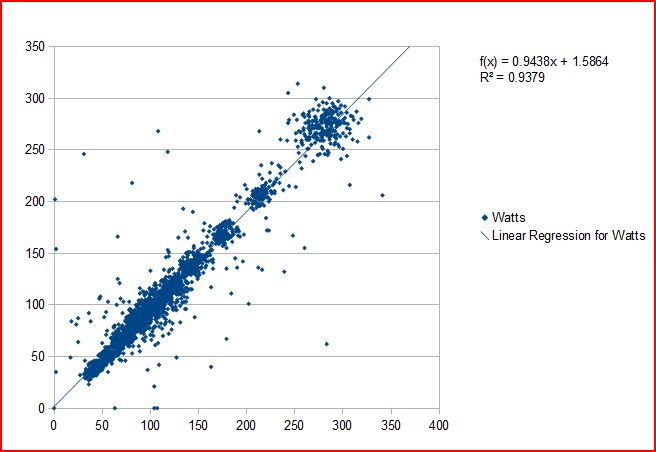
Looking closely, one can see that aside from a slight offset, the values reported by each power meter “track” very closely to each other. This can further be seen if the power values relative to each other are plotted on a point-by-point basis. The plot below shows the power reported at each point in time with the CinQo power values on the x-axis and the Power Pilot values on the y-axis.


Typically, due to factors such as variations in recording rates, calculation algorithms, etc. the sort of plot above doesn't turn out very well as a comparison tool for power meters. However, in this case, the point-by-point power reporting is fairly good and it appears that the Power Pilot reports ~94% of the power reported by the CinQo. Considering that the Power Pilot estimate is taking place “downstream” of the bicycle drivetrain losses (much like a PowerTap wheel) in comparison to the crank-based location of the CinQo, a ~6% drivetrain power loss is reasonable, and typical of an average drivetrain.


Rather than looking at the point-by-point plot and it's curve fit, often it's more useful to look at a plot of the averages reported by the power meters over constant power sections. The plot below is the same as the previous plot, but the averages over each of the “intervals” of the cassette sweep are plotted and a curve is fit to them. As can be seen the fit is fairly “tight” to the data and the slope of the fit (i.e. the drivetrain loss) is similar to that reported above, albeit slightly lower. This appears to point out that the correlation between the 2 devices may be slightly better during constant power efforts. Alternatively, it could reveal that the time correlation of the point-by-point data looked at above may be slightly “off”.


However, understanding where the power meters don't agree can sometimes be much more enlightening in that it can reveal systemic difference between the devices. One tool for doing this is something called a “Mean – Difference” Plot. This plot shows the difference between the power values reported by the 2 devices plotted against their average. The Mean-Difference plot of this ride is shown below:


The things to look for in this type of plot that reveal systemic “issues” are characteristics like the spread of the points getting larger or smaller with the mean power values or the difference not trending in a monotonic fashion. Neither of these types of issues appear to be present above, implying that the Power Pilot “agrees” with the CinQo output in a consistent and predictable manner.


Another area of interest for comparisons of this type is how the 2 devices respond to sprint type efforts. An additional ride was undertaken where a pair of short sprints were performed in order to see if there were any anomalies between how each device reported these efforts. As can be seen below, the shapes of the curves are very similar with the peak values also being very close to each other.


CONCLUSIONS

This brief examination of the power output of a LeMond Power Pilot on a Revolution trainer shows that it does an acceptable job at determining and recording the rider's power output when compared to a “known good” crank-based power meter. The power output is similar to what one would expect to see from a hub-based power meter, which is favorable for the likely customer base for this product, namely users with no other power meter or Power Tap owners who want to train indoors with and/or by power.

Saturday, January 26, 2013

What's the Virtual CdA and Crr of the LeMond Revolution Trainer?


...and, more importantly, what's the "equivalent mass"?

Back in 2011, I was given access to a LeMond Revolution trainer.  One of the selling points of this trainer is it's "road feel", and knowing that the load was produced by air drag, I decided to see if I could figure out what the "virtual" CdA (drag coefficient) and Crr (rolling resistance coefficient) was for the trainer, just to see if it reasonably represented a typical rider and equipment.  Another part of the "road feel" is the inertial mass of the trainer's flywheel, and I was hoping I could figure out the "equivalent mass" that the flywheel represented.  In other words, what mass of a rider (plus bike) traveling down the road does the spinning flywheel mass represent?  Some of you reading this may recognize the figures from a thread I started back then on the Slowtwitch.com forum, and also one on the wattagetraining.com forum.

The majority of the load experienced by a cyclist when riding outside on level ground is produced by aerodynamic drag and the rolling resistance of the bicycle equipment (tires mostly, but bearings as well...) and is very simply represented by the following equation (assuming still air as well).

Power = Aero drag power + rolling resistance power, or

Power = (1/2 x air density x CdA x V^3) + (Mass * g * Crr * V),
 where V is the velocity of the bike and g is the gravitational constant.

This equation is handy, because if you divide both sides by V, you end up with a linear equation with respects to the variable V^2.  In other words, the equation of a line is:

Y = mx + b, or dependent variable = (slope * independent variable) + (y-intercept)

What that means is: if you are able to measure the power it takes to travel at various bike velocities, then if you plot the Power/Velocity on the y-axis and the Velocity^2 on the x-axis of a chart, you should see a line where the slope is equal to the CdA and the y-intercept is the Crr.  In fact, this technique is a common one used in field testing and is sometimes known as the "regression method", since it allows one to easily do a linear regression fit to the data.  I just thought I'd apply it to the wind trainer as well...

Here's the result of a constant cadence cassette sweep (only 9 of the 10 cogs of a 12-25 cassette, 60 rpms, with a repeat of the 53-14 at 75 rpm for some slightly higher power.) After the sweep, I did some accelerations/decelerations for the purposes of doing some inertial mass estimate.


Taking the average of the power and "virtual speed" (i.e. the result of the gearing, cadence, and assumed wheel rollout) over the last 2 minutes of each step (and the last 1 minute of the 75 rpm step), I then plotted P/V vs. V^2 for the following:


That looks pretty good!  Nice and linear, which means it basically "behaves" like a rider on the roadAssuming an "all-up" mass of 85kg, and a rho (air density) of 1.2 kg/m^3, that y-intercept works out to represent a Crr = .0051 and the slope of the line works out to represent a CdA = .350 m^2. Sounds like a fairly "normal" road bike position (on the hoods) and Crr.  Nice.

Now...about that estimate of inertial mass. My intent was to plug the file and the calculated Crr and CdA into my VE ("virtual elevation") spreadsheet and then modify the mass entry until the small "hills" formed by the accelerations/decelerations "flatten out"...I tried that, but I realized that I needed to reconsider how varying the mass entry affects the calculated rolling resistance force.  See below.  In a perfect representation, that trace shown below would be completely level.  The fact that it's not means that something is amiss with the modeling, probably the acceleration terms.

BTW, "virtual elevation" is a technique of analyzing power files created by Robert Chung which allows one to estimate drag coefficients given a certain Crr, or vice-versa. See a presentation on the subject by Robert Chung here.


At about this time in the Slowtwitch thread, Robert asked to take a closer look at the acceleration sections near the end.  Here's what that looked like:


He then asked to see the VE trace in an overlay on the speed trace and so this is what I showed him:


At this point he said: "I presume you were using an all-up mass of around 80kg? So cut that in half to 40kg and double the Crr to .01. That'll keep the steady state power the same but should improve the modeling for the KE component."  

Here's what it looked like with the mass decreased by half to 42.5 kg and the Crr increased to .0105 (I played with the Crr to get the best "fit"):   

The VE changes between the gear changes at least seemed to have been "smoothed" over...but the accels/decels at the end were still a bit "spikey".
 
To that, his response was: "Cool. In the original, the VE was "countercyclical" to the speed. Now it's cyclical. I think that means halving the mass was an overcorrection. So the inertial mass is somewhere between 42.5 and 85."

I then played around with the mass and Crr a bit and here's the "best fit" I could find...and I mostly judged it off of the final "tail" which was a coast down to zero rpm. I adjusted the mass (and Crr accordingly) until the final steady-state leg and the coast down to zero had a minimum of "disjoint". This case was actually 100 lbs (45.5 kg) and a Crr of .0094 


Now...we'll see how close that is to a calculated mass based on the flywheel geometry! 

I then pulled the flywheel cover off and measured up the flywheel on the trainer. To calculate the mass moment of inertia, I decided to just throw the dimensions into Pro/E and let it do the calculations:  


Here's the mass properties output:

VOLUME = 8.0428750e-04 M^3
SURFACE AREA = 2.0893183e-01 M^2
DENSITY = 7.8887728e+03 KILOGRAM / M^3
MASS = 6.3448414e+00 KILOGRAM

CENTER OF GRAVITY with respect to _GL_FLYWHEEL coordinate frame:
X Y Z 0.0000000e+00 0.0000000e+00 2.4937030e-02 M

INERTIA with respect to _GL_FLYWHEEL coordinate frame: (KILOGRAM * M^2)

INERTIA TENSOR:
Ixx Ixy Ixz 4.2069766e-02 0.0000000e+00 0.0000000e+00
Iyx Iyy Iyz 0.0000000e+00 4.2069765e-02 0.0000000e+00
Izx Izy Izz 0.0000000e+00 0.0000000e+00 7.3130437e-02

INERTIA at CENTER OF GRAVITY with respect to _GL_FLYWHEEL coordinate frame: (KILOGRAM * M^2)

INERTIA TENSOR:
Ixx Ixy Ixz 3.8124192e-02 0.0000000e+00 0.0000000e+00
Iyx Iyy Iyz 0.0000000e+00 3.8124191e-02 0.0000000e+00
Izx Izy Izz 0.0000000e+00 0.0000000e+00 7.3130437e-02

PRINCIPAL MOMENTS OF INERTIA: (KILOGRAM * M^2)
I1 I2 I3 3.8124191e-02 3.8124192e-02 7.3130437e-02

ROTATION MATRIX from _GL_FLYWHEEL orientation to PRINCIPAL AXES:
1.00000 0.00000 0.00000
0.00000 1.00000 0.00000
0.00000 0.00000 1.00000

ROTATION ANGLES from _GL_FLYWHEEL orientation to PRINCIPAL AXES (degrees):
angles about x y z 0.000 0.000 0.000

RADII OF GYRATION with respect to PRINCIPAL AXES:
R1 R2 R3 7.7515746e-02 7.7515748e-02 1.0735906e-01 M

The value we're interested in is the the Izz value of .073 kg*m^2.

So...how do we equate this to an "equivalent mass" translating down the road? I like to do it by equating the kinetic energy of the flywheel to the kinetic energy of a bike+rider moving down the road.

Kinetic Energy of rider = Kinetic Energy of the Flywheel
KErider = KEf
1/2 x mass of rider x (velocity of bike)^2 = 1/2 x Izz x (flywheel rotational speed)^2
Mr x Vb^2 = Izz x (Wf)^2

OK...to solve this, I need to equate the flywheel rotational speed (in radians per second) to the equivalent bike velocity (in meters/second). Well, the assumption above was that the wheel rollout was 2080mm, or 1 revolution = 2*Pi radians is equivalent to 2080mm of rollout.

Wheel rotation rate = Ww = Vb x (2*Pi radians/2.080m), where Vb is in m/s, so Ww = 3.0208 x Vb.

Now, to figure the flywheel rotational rate, we need to know the pulley ratio of the drive pulley and the flywheel pulley. By my measuring, this ratio is 8:1. So, the flywheel rotational rate, Wf = 8 x Ww = 8 x 3.0208 x Vb = 24.166 x Vb.

Lastly, I'll plug this relation into the simplified KE equation above along with the calculated Izz from the solid model.

Mr x Vb^2 = Izz x (24.166 x Vb)^2
Mr = Izz x 584 = .073 x 584 = 42.6 kg

42.6 kg is equivalent to a rider weight of ~94 lbs...now, that's also not including the other rotating bits (like the pulleys, cassette, etc.)...but that's pretty darned close to the "equivalent mass" determined using the coastdown and VE above :-D  


So...in the end, what does that all mean?  Well, I'll end with one more quote by Mr. Chung: 

"Aha. Excellent. It may "coast" better than regular trainers -- but not as well as a bike on a flat road. Likewise, it appears to accelerate faster than a bike on a real road. Steady state load is reasonable, though."

Sounds good to me.

Saturday, January 12, 2013

What's up with those funky rings...?


With the successes of Bradley Wiggins in 2012, there has been a lot of interest shown lately on the non-round rings he's been riding.  These rings are nothing new, and non-round rings have been dabbled with for a very long time, but the objective data (physical tests, as opposed to mathematical modeling) on whether or not these rings allow for a greater power output than round rings has been mostly in the negative.  Yet, there are typical reports of riders seeing 15-20W (or more) increases in their power output after mounting them on their bikes.  For a while, it's been speculated that some of these reports may be the result of an artificial inflation due to the way that some power meters calculate their power readings, and mathematical analyses along with user reports have suggested that the "real world" matches the artificial inflation theory.

What is this "artificial inflation" theory, you might ask?  Well, to understand the theory, first one has to understand how bicycle power meters measure and calculate power.  Simply put, for the most common power meters on the market (I'm talking SRM, Quarq, and PowerTap) there is a torque measurement that is averaged over a certain "window" that is then multiplied by the angular velocity to get power, i.e.

Power = Torque x Angular Velocity

However, the power output of a cyclist isn't constant torque, like with an electric motor, for example.  Instead, torque input to the crankarms of a bike is pulsed, with the majority of the torque being applied in a fairly narrow range during the pedal downstroke.  As such, if one plots torque vs. pedal position over a single pedal revolution, you'll typically see a sinusoidal-type plot with 2 "peaks" per pedal revolution.  Because of this, in order to better represent the true power output of a cyclist, the SRM and Quarq power meters have been designed to use what's known as an "event-based" power calculation algorithm.  What this means is that the torque is averaged over a complete pedal revolution (no matter how long it takes) and then the average torque is multiplied by the average angular velocity over that single pedal revolution.  This way, the only measure of angular velocity is a simple magnet/reed switch construction whereby each crank trigger signifies that 360 degrees of pedal rotation have been accomplished in the time between magnet pulses on the reed switch.  The over-riding assumption of this architecture is that the crank velocity does not vary significantly from the average during the pedal revolution, and with the high inertia of a cyclist traveling on the road at any reasonable speed, this is a fairly accurate assumption...with round rings that is.  If tension is maintained in the chain of the bicycle during the pedal stroke, then by definition the crank rotational velocity will be fairly steady.  If one where to be able to measure the instantaneous rotational velocity and the instantaneous torque and calculated the instantaneous power, then if you averaged all of those instantaneous power calculations over the complete pedal revolution, the result would be very close to averaging the torque over the complete pedal cycle and multiplying by the average rotational velocity.  This is why PMs have been designed this way.

Now then, how does this factor into non-round rings possibly causing artificially inflated power values?  Well, the way that most non-round rings are designed to "work" (one exception being the old Shimano Biopace rings) is that the effective chainring size is increased during the times that the legs are applying the highest amount of torque (and, since the system needs to be symmetric, also during the time when the leg is rising back into position in the "recovery" portion.  But, I digress..) and the effective chainring size is decreased during the portions of the pedal stroke across the top and bottom of the cycle. This causes the instantaneous rotational speed of the crank to vary in a roughly sinusoidal manner (dependent on the shape of the ring) above and below the average crank rotational velocity.

For a given wheel speed and for equivalent number of teeth on the chainring, the average rotational velocity of a non-round ring will be the same as for a round ring.  This is true because in order for the teeth to be at a spacing of 1/2", that means that the circumferences of a non-round and round ring of the same tooth count are equivalent.  However, with a non-round ring that means that, by design, the rotational velocity of the crank is being manipulated such that the rotational speed of the crank is slowed during the downstroke (and upstroke portions as well due to symmetry) to a value below the average

So, what does that mean?  In short, it means that during those times that the largest torques are being applied, the rotational velocity is lower than the average over the complete pedal revolution.  Since the majority of the power is produced in the downstroke portion of the pedal cycle, this means that power reported will tend to be over-reported, hence the term "artificial power inflation".  Get it?

So, that's the theory...how does it end up working in reality?  Well, in short, reality matches the theory fairly well and by my measurements, using Osymetric rings on a Quarq power meter will cause the Quarq to report a power value ~2.7-3.5% higher than reality.

Here's some testing I did near the end of 2012:

The setup: 

Test performed on a LeMond Revolution trainer to maintain a rear "wheel speed" similar to riding on the road (i.e. high flywheel inertia)
 
54T Round and 54T Osymetric both mounted on the same Quarq with the Osymetric in place of the inner ring. This was done to eliminate changes in drivetrain losses due to using different cogs. Calibration shows the Round ring (mounted on the outer position) reads 1% high and the Osymetric (mounted on the inner position) reads 1% low and the torque slope was set to the average value between the 2 rings. Power values from the Quarq reported below were corrected based on the calibration. Zero offset was checked before the first pair of runs, before the 2nd set of runs, and then at the finish. Offset did not move by more than 5 counts (512, 507, 511) which is equivalent to 1.3W @ 80 rpm. Runs were ~4 minutes in length.

Runs in order of performance:
- 54x15 gear, 80 rpm (36.2 km/hr indicated)

  • Round Ring (Quarq - corrected) = 262.0W, LeMond Power Pilot = 249.5W, HR=160 bpm
  • Osymetric    (Quarq - corrected) =271.3W, LeMond Power Pilot = 250.3W, HR=166 bpm

- 54x16 gear, 80 rpm (34.1 km/hr indicated)

  • Osymetric  (Quarq - corrected) = 227.5W, LeMond Power Pilot = 212.3W, HR=158 bpm
  • Round Ring (Quarq - corrected) =221.6W, LeMond Power Pilot = 212.0W, HR=161 bpm

So, in brief, based on just this limited test, there actually DOES appear to be a "non-round ring inflation factor" of 2.7%-3.5%. (BTW, Dan Connelly estimated a 4% "inflation" based on a 20% within pedal stroke speed variation here (http://djconnel.blogspot.com/...uniform-cadence.html) and by my measurements the Osymetric ring would cause a 20% crank speed variation assuming a constant rear wheel speed.


I followed up the trainer testing rides outside where I ran a PT wheel on the same bike as the Quarq/Osymetric setup with the large ring being the non-round ring and the small ring being roundThe artificial inflation with the non-round ring was observed there as well with the difference between the power as measured by the Quarq as compared to the PT being ~4% higher when in the non-round ring under a continous effort.
 
So, there you have it...my suspicion is that a good majority of the power "improvements" claimed with non-round rings are merely mis-measurements of the actual power.  It's important to note that this sort of power inflation is not anything that can be "calibrated out".  It will be present even if the PM torque calibration is perfect since it's a result of the power calculation algorithm itself and ANY power meter that employs an "event-based" calculation as described above will suffer from it.

Now then...on the question of whether or not non-round rings have the potential to actually increase pedaling power output...well, I have my opinions on that, but I'll leave that for another blog post....